Compare Data with iMac Mockup Layout
Product Description
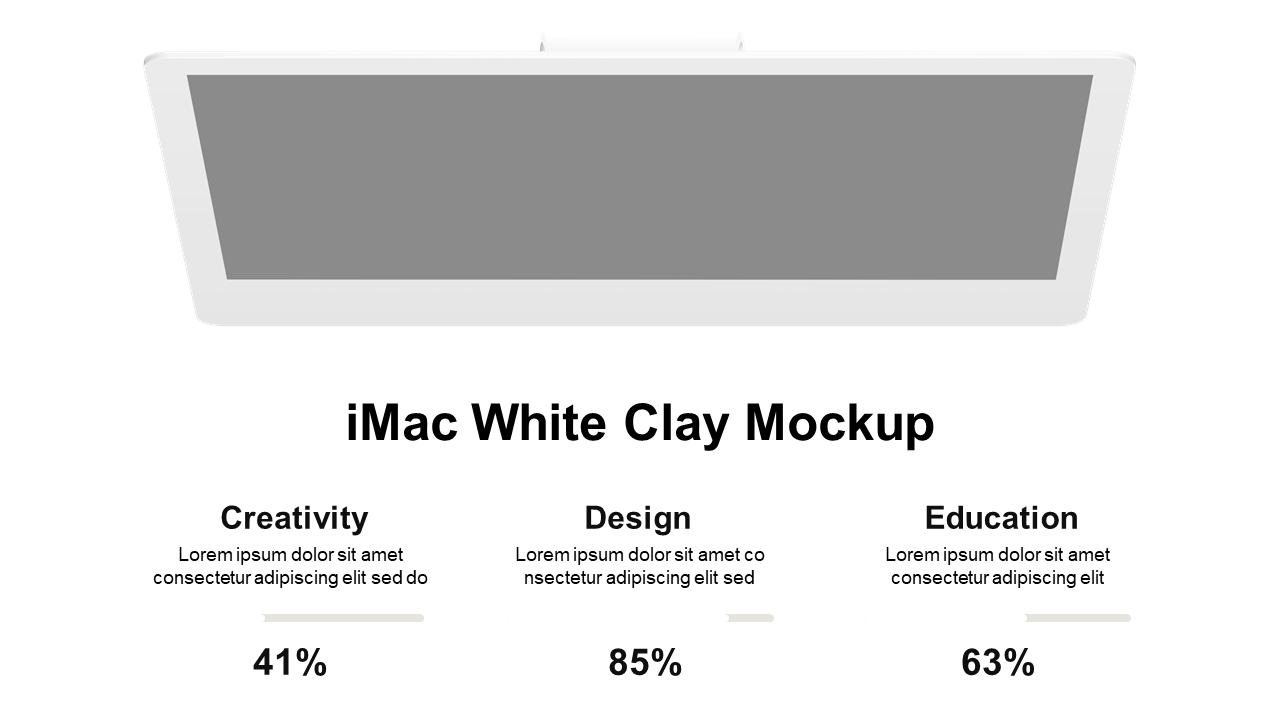
Are you struggling to compare data in a way that’s visually engaging and easy to understand? This layout featuring an iMac mockup helps you present percentage data clearly, ensuring your audience can grasp your comparisons at a glance.
This slide is exceptionally useful for data analysts, marketers, and educators who need to present comparative insights across fields like creativity, design, and education during team meetings or strategy sessions. The design allows you to effectively communicate key points without clutter.
For just $0.99, you can access this slide for immediate download and customize it effortlessly in PowerPoint and Google Slides. Adapt the mockup to fit your specific data needs and be presentation-ready in no time.
$0.99 – Purchase Checkout
Added to cart







