Showcase Usability Metrics with iMac Mockup
Product Description
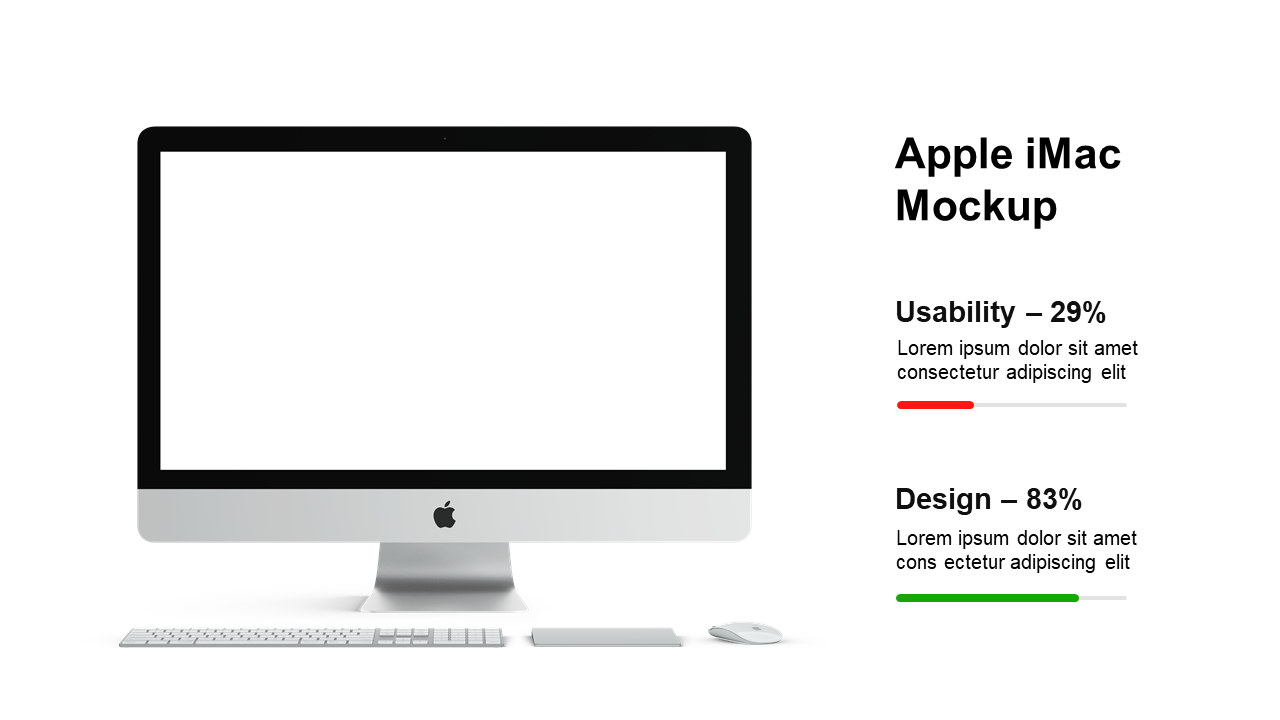
In a world driven by data, presenting metrics effectively can be the key to making informed decisions. It’s not enough to simply have the data; you need to communicate it clearly and visually. This slide, featuring an iMac mockup, helps you showcase usability metrics in an eye-catching way that keeps your audience engaged.
Perfect for data analysts presenting findings, product managers discussing user feedback, or marketers showing the impact of usability improvements, this slide fits well in workshops, client meetings, or team debriefs. You’ll have a visually appealing option that can transform complex data into insightful narratives.
You can grab this slide for only $0.99, and it’s ready for instant download. It’s easy to edit in both PowerPoint and Google Slides, so
you can customize it to suit your specific needs and get your presentation ready in minutes.
$0.99 – Purchase Checkout
Added to cart







