Simplify Ideas with Quadrant Diagram for Business

Product Description
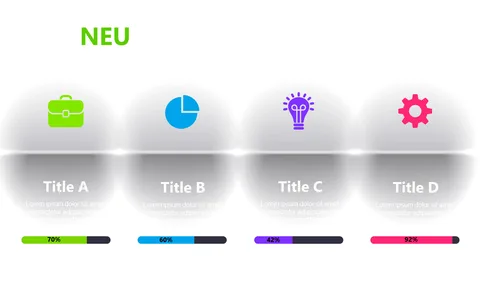
In a fast-paced work environment, simplifying complex information is essential yet challenging. This quadrant diagram slide organizes your data into four clear sections, each represented with intuitive icons, making it easy for your audience to understand critical points without feeling overwhelmed.
Business analysts, financial advisors, and product managers will find this slide especially useful during strategy meetings, performance reviews, or product evaluations. It helps ensure that every essential detail is communicated clearly and effectively, supporting informed decision-making.
Available for only $0.99, this slide is ready for instant download and can be easily modified in PowerPoint and Google Slides. You’ll be able to create a clear, organized presentation in just minutes, saving you time and stress.
$0.99 – Purchase Checkout
Added to cart