Showcase Benefits with Triangular Step Comparison
Product Description
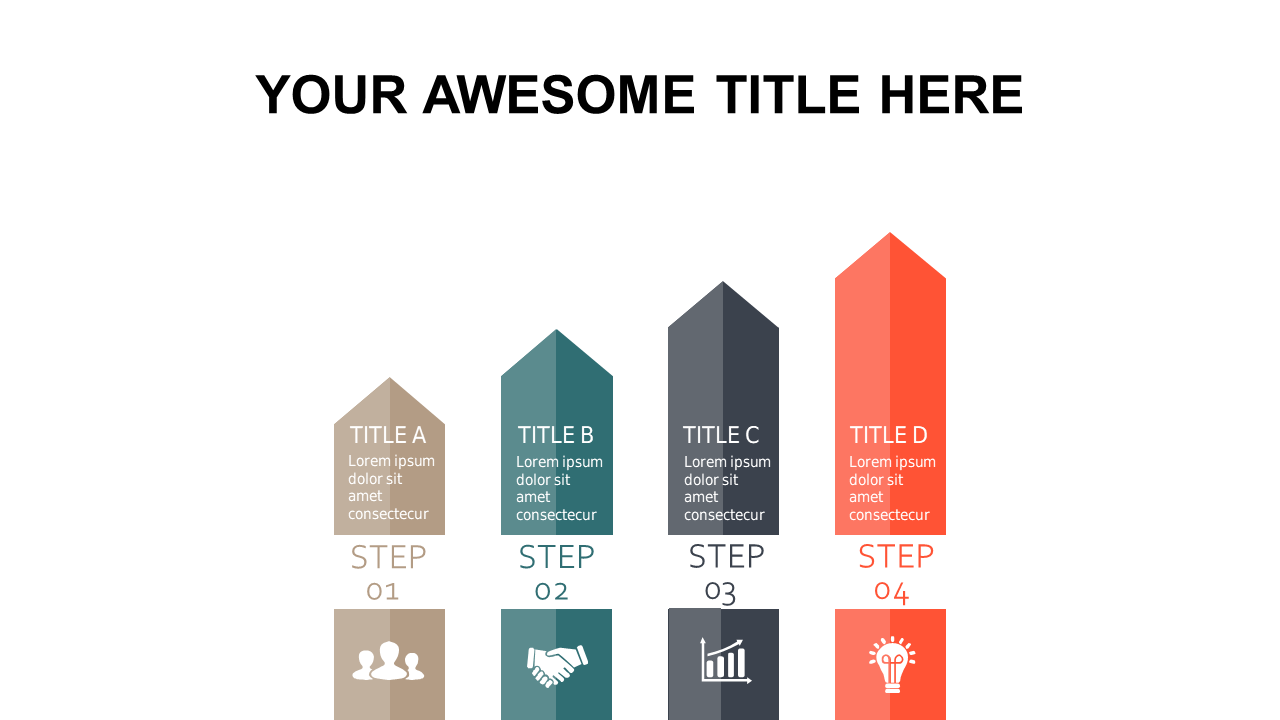
Communicating complex benefits can often lead to misunderstandings, especially when trying to compare multiple options. This triangular step comparison slide is designed to make it easy to present data clearly, allowing your audience to see how different features stack up against each other.
The visual appeal enhances understanding and keeps attention focused. Data analysts presenting findings to executives will find this slide invaluable, as will marketing teams comparing product features in strategy sessions. It’s also a great choice for educators who want to illustrate various benefits of teaching methodologies during staff meetings.
At just $0.99, you can quickly download this slide and customize it to fit your needs. It’s compatible with both PowerPoint and Google Slides, making editing a breeze!
$0.99 – Purchase Checkout
Added to cart