Visualize Annual Product Performance with Bar Charts
Product Description
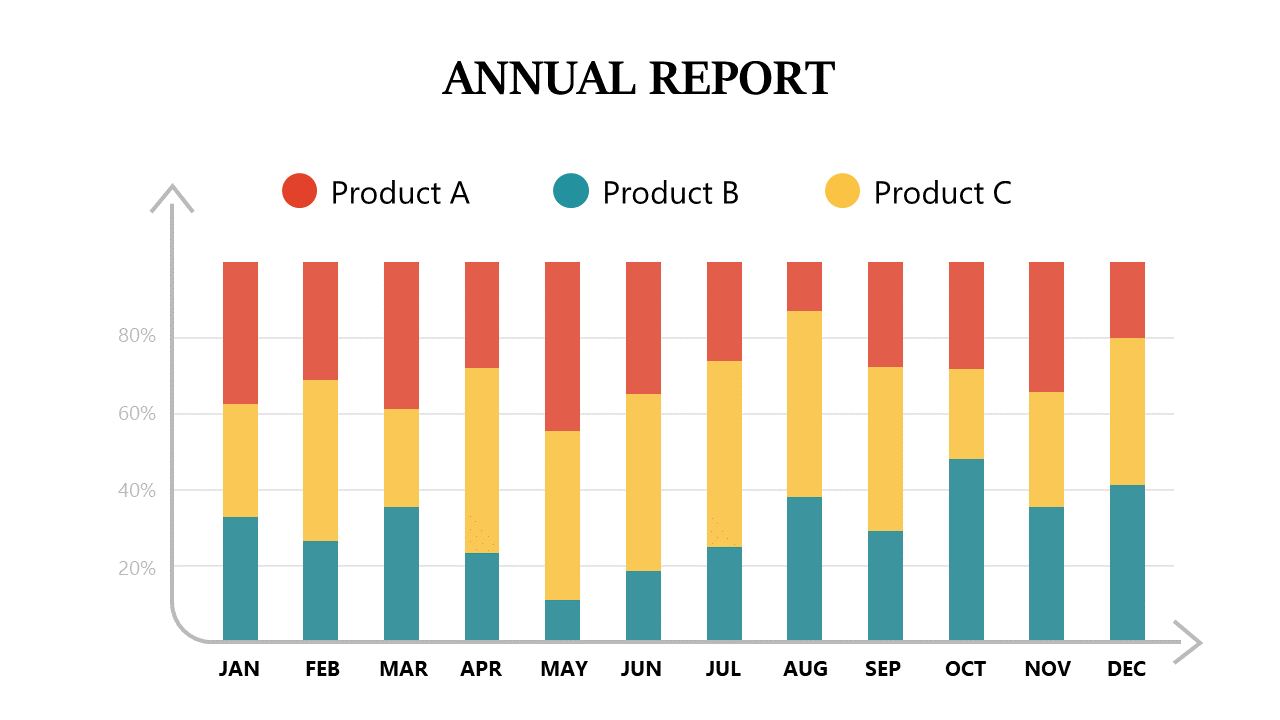
Showcasing annual product performance can feel overwhelming when you’re trying to highlight key data points. This slide simplifies your task with a stacked bar chart, allowing you to display monthly performance trends for different products clearly.
Visual representation makes it easier for your audience to identify successes and areas that need improvement. This slide is ideal for marketing managers delivering year-end reviews, financial analysts summarizing sales data for executives, or product owners discussing performance metrics in agile retrospectives. Whether you’re in a formal boardroom setting or an informal team meeting, this chart can make the information stand out and drive insightful discussions.
For only $0.99, you can instantly download this slide and edit it to fit your specific data needs in PowerPoint or Google Slides. You’ll be ready to present critical insights in no time, allowing you to concentrate on delivering impactful messages.
$0.99 – Purchase Checkout
Added to cart







