Communicate Progress with Colorful Indicators V4
Product Description
Presenting data effectively can be a challenge, especially when trying to convey progress in a way that captures attention. You want your audience to easily grasp key metrics without getting lost in a sea of numbers.
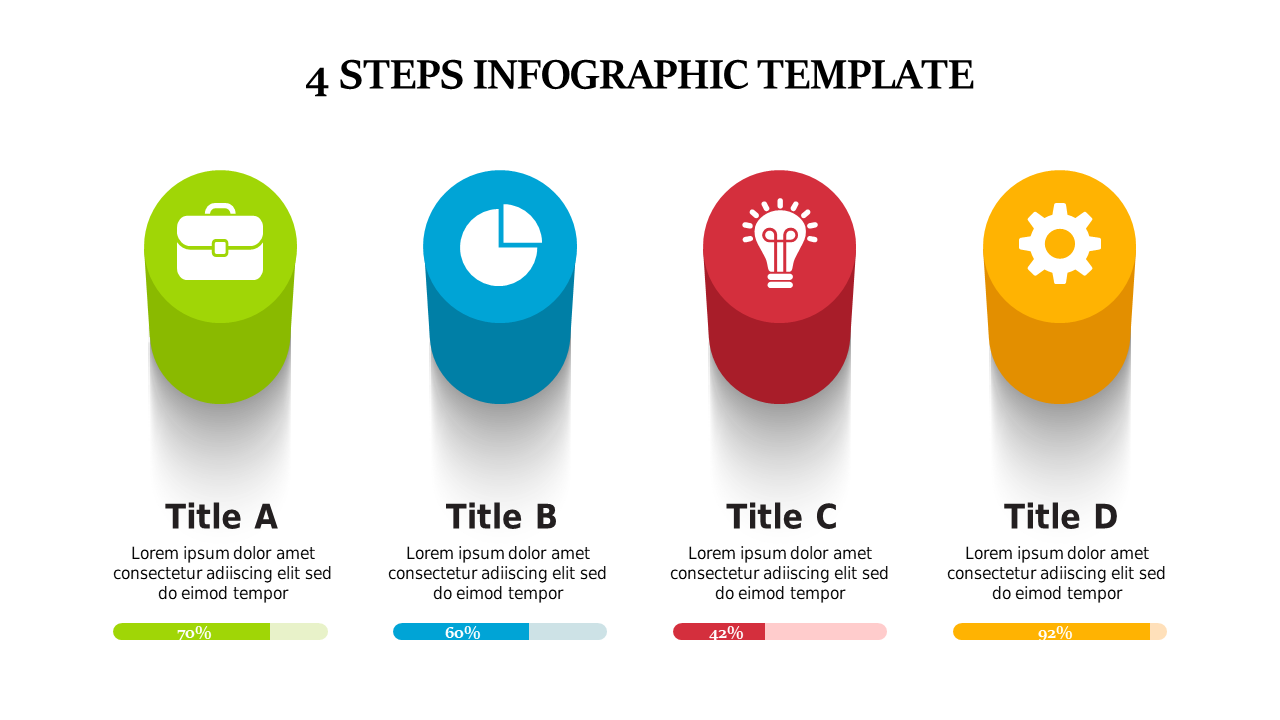
Colorful indicators help transform complex data into an engaging visual story. Data analysts, project managers, and team leaders can benefit from this slide during performance reviews, project updates, or client presentations. Whether you’re reporting on quarterly growth metrics or tracking project milestones, this visual aid makes it easy to communicate your message clearly and effectively.
At just $0.99, you can download this slide instantly and customize it to fit your needs in PowerPoint or Google Slides. Editing is straightforward, allowing you to tailor the design to your presentation style in minutes.
$0.99 – Purchase Checkout
Added to cart







