Highlight Metrics with Colorful Progress Indicators V3
Product Description
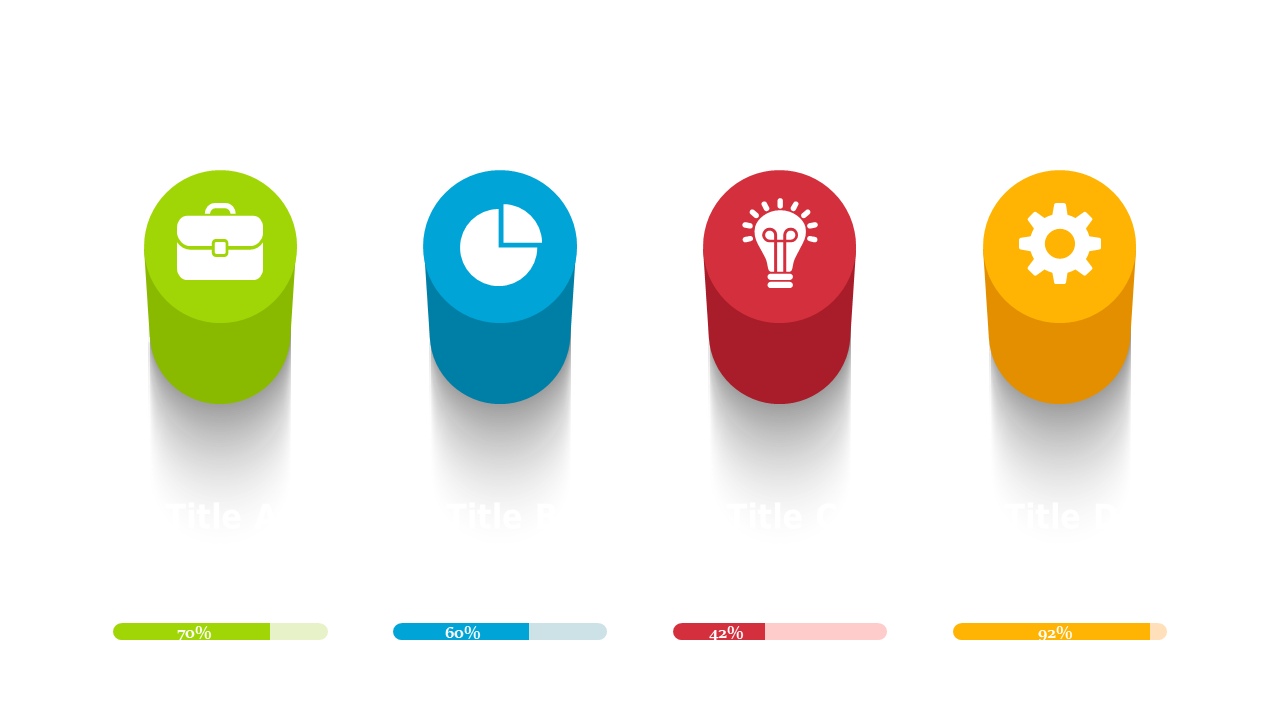
Communicating financial metrics can often feel overwhelming, especially under tight deadlines. This Colorful Progress Indicators V3 slide offers a striking visual way to represent your key figures, making it easier for your audience to grasp your performance metrics quickly.
The incorporation of vibrant colors ensures that your essential data stands out. Finance leads, budget analysts, and accountants can effectively utilize this slide during financial reviews, budget discussions, or performance tracking sessions. Its design is tailored to help you convey complex financial information in a manner that captivates and engages your stakeholders.
At just $0.99, you can download this slide right now, and it’s simple to edit in PowerPoint or Google Slides. You’ll be set up and ready to deliver that critical presentation in no time.
$0.99 – Purchase Checkout
Added to cart







