Visualize Product Sales with Waterfall Chart
Product Description
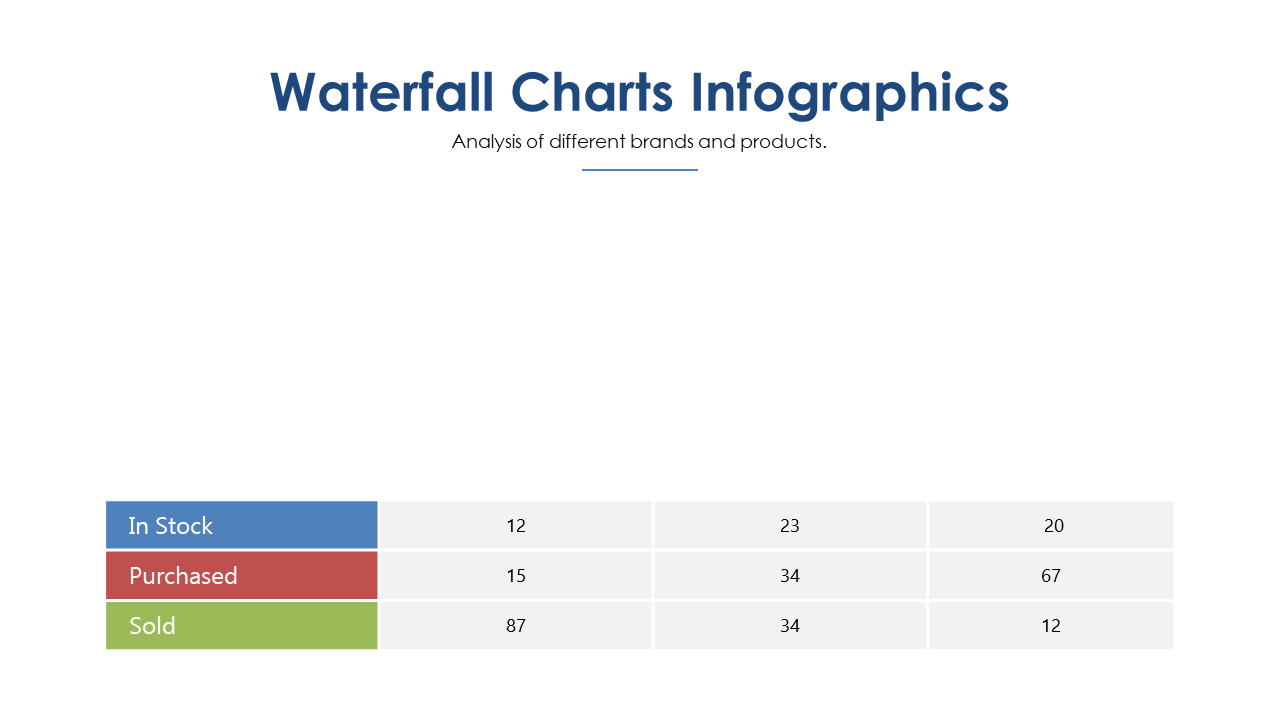
Communicating product sales effectively can be a challenge when dealing with intricate data. This Waterfall Chart slide addresses that issue by providing a visually appealing way to depict fluctuations in sales figures, enabling you to track progress and setbacks with clarity.
Sales managers, financial analysts, and product owners will find this slide invaluable for sales presentations, performance updates, and strategy sessions. Whether you’re dissecting monthly sales reports or presenting outcomes to the board, this slide enhances understanding and engagement.
For only $0.99, you can download this slide immediately and edit it in PowerPoint or Google Slides. It’s quick and easy to tailor it to your specific data, making your presentation ready in no time.
$0.99 – Purchase Checkout
Added to cart







