Visualize Project Performance with Waterfall Chart
Product Description
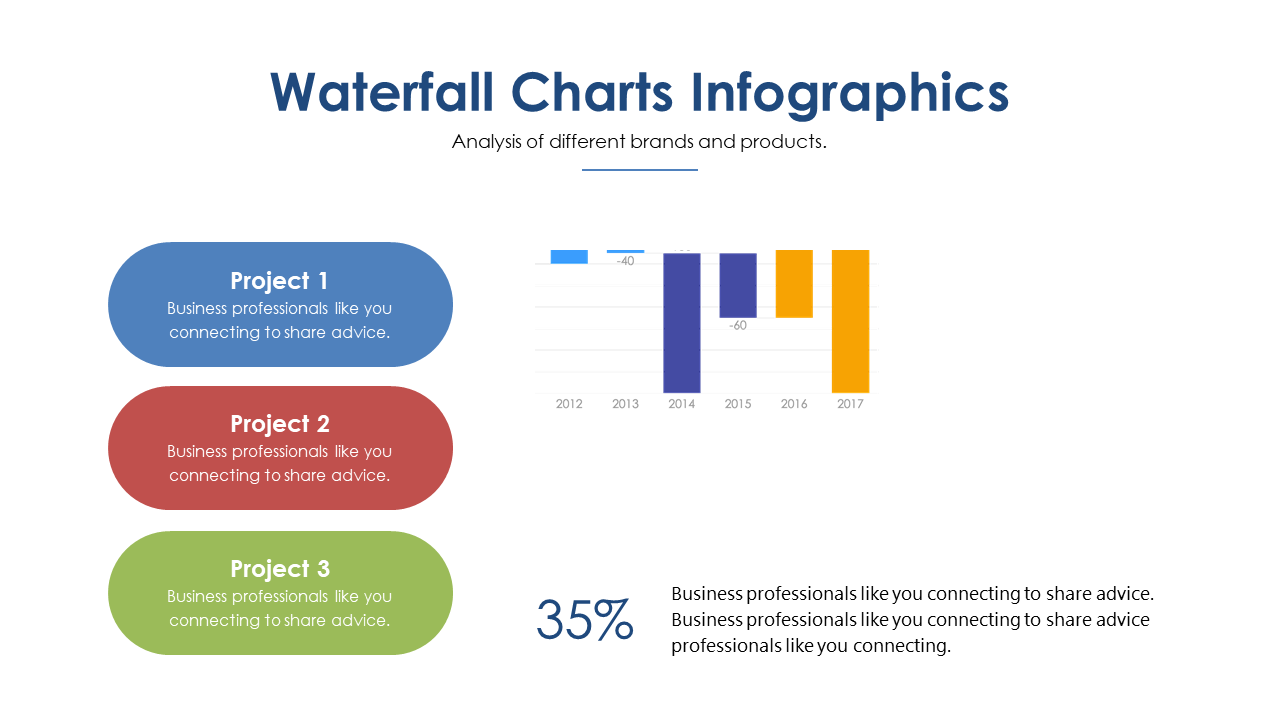
Managing project performance can quickly become complicated when numbers and metrics begin to pile up. This Waterfall Chart slide helps clarify how individual projects contribute to overall performance, making it easier for your audience to understand progress over time.
It transforms complex data into clear visuals that tell a compelling story. Project managers, team leaders, and operational analysts will find this slide extremely helpful in status meetings, project reviews, or when pitching new initiatives. It enables you to clearly illustrate project impacts, timelines, and contributions, ensuring everyone is on the same page regarding project goals and outcomes.
For just $0.99, this slide is available for instant download, allowing you to get started right away. You can easily edit it in both PowerPoint and Google Slides, ensuring that you can tailor it to fit your specific project needs in a matter of minutes.
$0.99 – Purchase Checkout
Added to cart







