Analyze Brand Performance with Waterfall Chart
Product Description
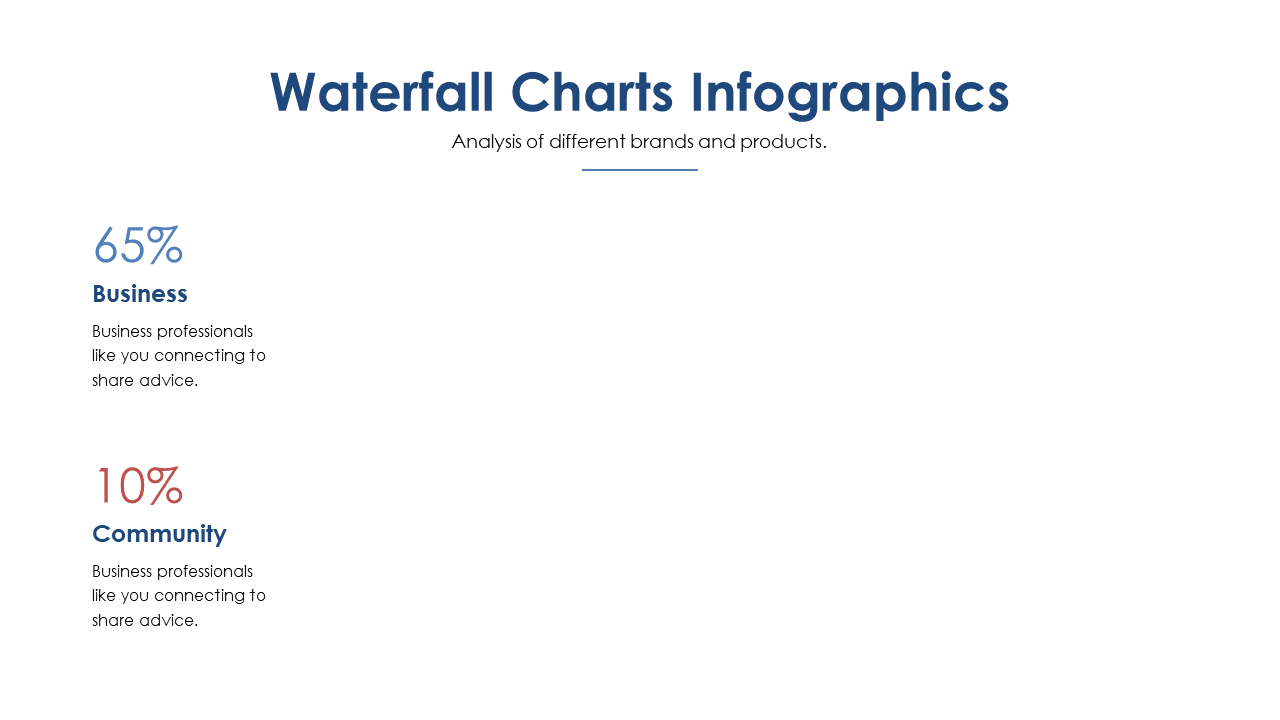
Articulating brand performance can feel intimidating, especially when different factors affect your metrics. A clear visualization that outlines these variables can transform confusion into clarity, allowing your audience to see the relationships between elements and performance.
This slide fits right in for marketing directors analyzing campaign effectiveness, product managers reviewing sales feedback, or business analysts discussing market trends with colleagues. It’s designed to help you present your findings in a compelling way.
For just $0.99, this slide is ready for instant download and can be edited easily in PowerPoint and Google Slides. Get your presentation ready in minutes, ensuring that your insights shine through.
$0.99 – Purchase Checkout
Added to cart







