Visualize Social Media KPIs with Circular Progress Bars
Product Description
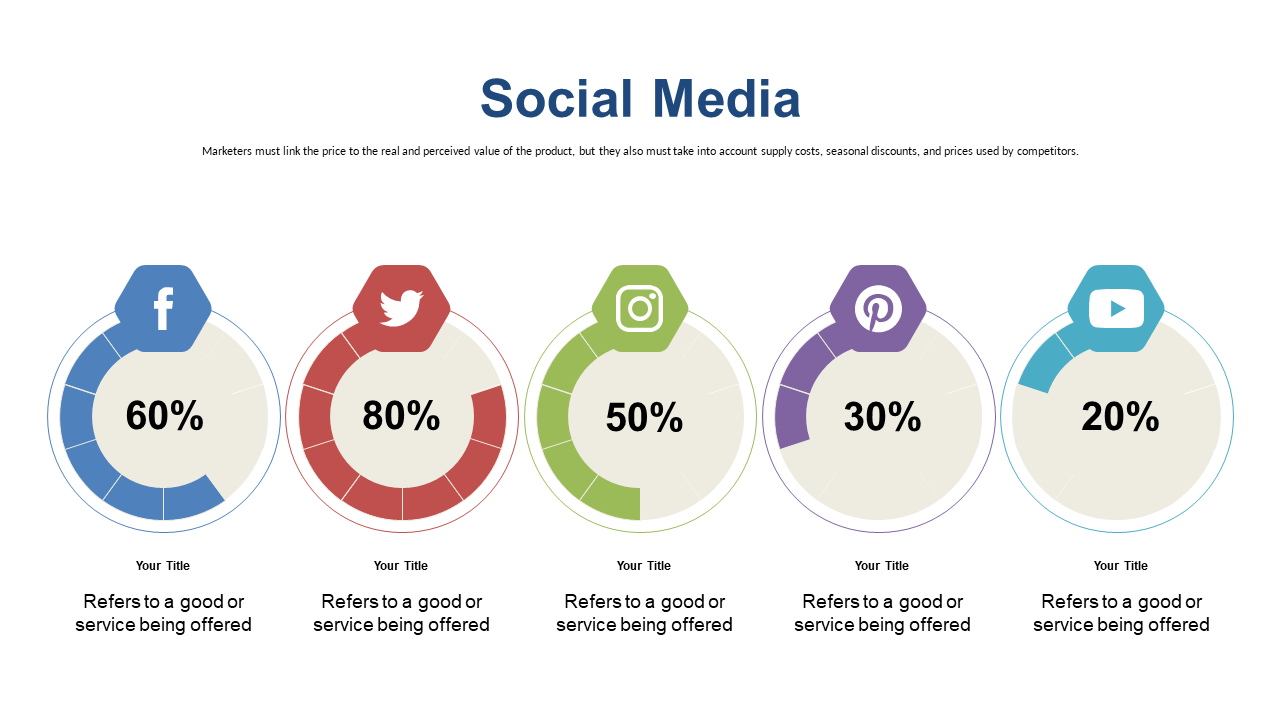
Presenting complex social media KPIs can often feel like you’re speaking a different language to your audience. When you’re trying to communicate performance metrics in a meeting, clear visuals can help bridge that gap, making it easier for everyone to understand the data at hand.
Circular progress bars can transform dense information into digestible visuals, ensuring your message hits home. This slide is perfect for social media managers preparing performance reviews, marketing analysts presenting quarterly results, or even business developers discussing growth metrics. If you’re in a fast-paced marketing environment where data-driven decisions are critical, this template will serve you well during strategy sessions or client pitches.
For just $0.99, you can download this slide instantly and edit it in PowerPoint or Google Slides. Make your data presentation easier and more effective in just a few minutes.
$0.99 – Purchase Checkout
Added to cart







