Present Engagement Metrics with Editable Pie Chart
Product Description
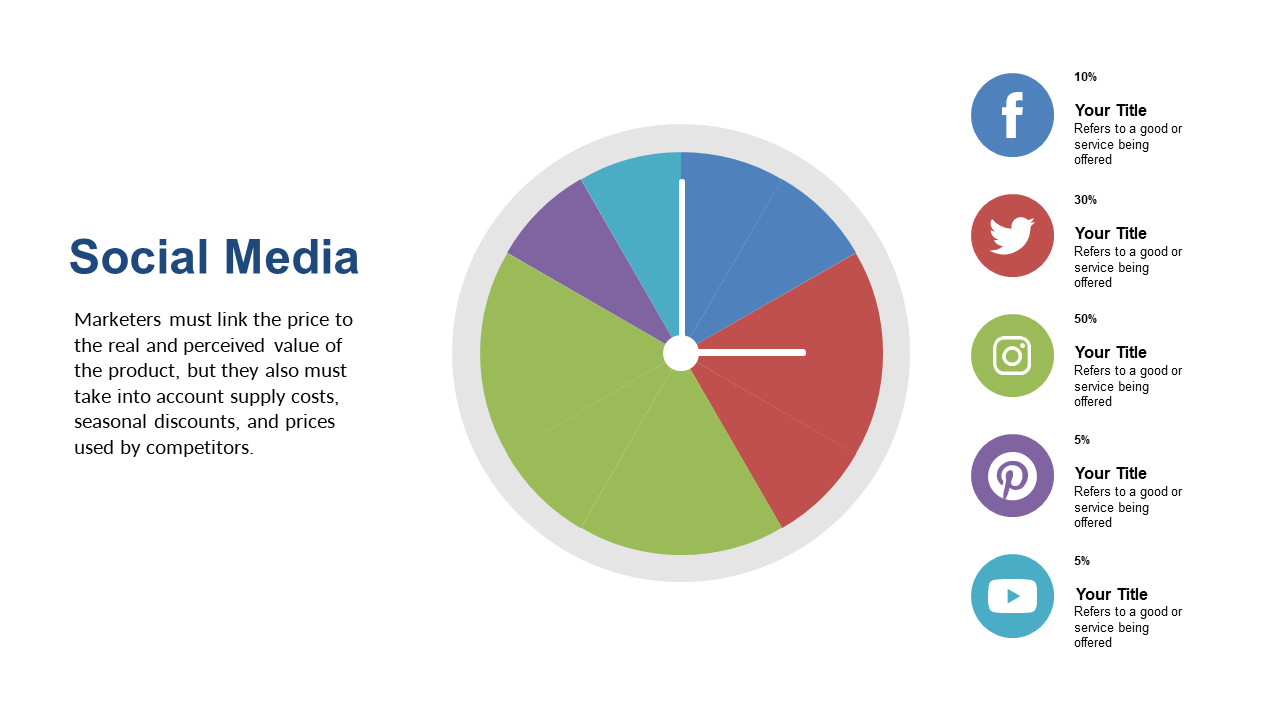
Understanding engagement metrics can be daunting, especially when time is of the essence and you need to get your point across. This editable pie chart takes away the guesswork by clearly displaying engagement data in a format that’s both easy to understand and visually striking. The design helps you transform overwhelming information into actionable insights for your audience.
You’ll find this slide perfect for social media coordinators, marketing specialists, or project managers preparing presentations for performance reviews or team strategy discussions. Imagine walking into a meeting, armed with an eye-catching chart that effortlessly communicates your social media engagement performance, making your data more impactful.
It’s just what you need for a clear presentation that resonates with your audience. For just $0.99, you can download this slide right away and customize it in both PowerPoint and Google Slides. It’s user-friendly, so you can tailor it to your specifications in no time, ensuring your presentation is both informative and visually engaging.
$0.99 – Purchase Checkout
Added to cart







