Visualize Engagement Metrics with Editable Pie Chart
Product Description
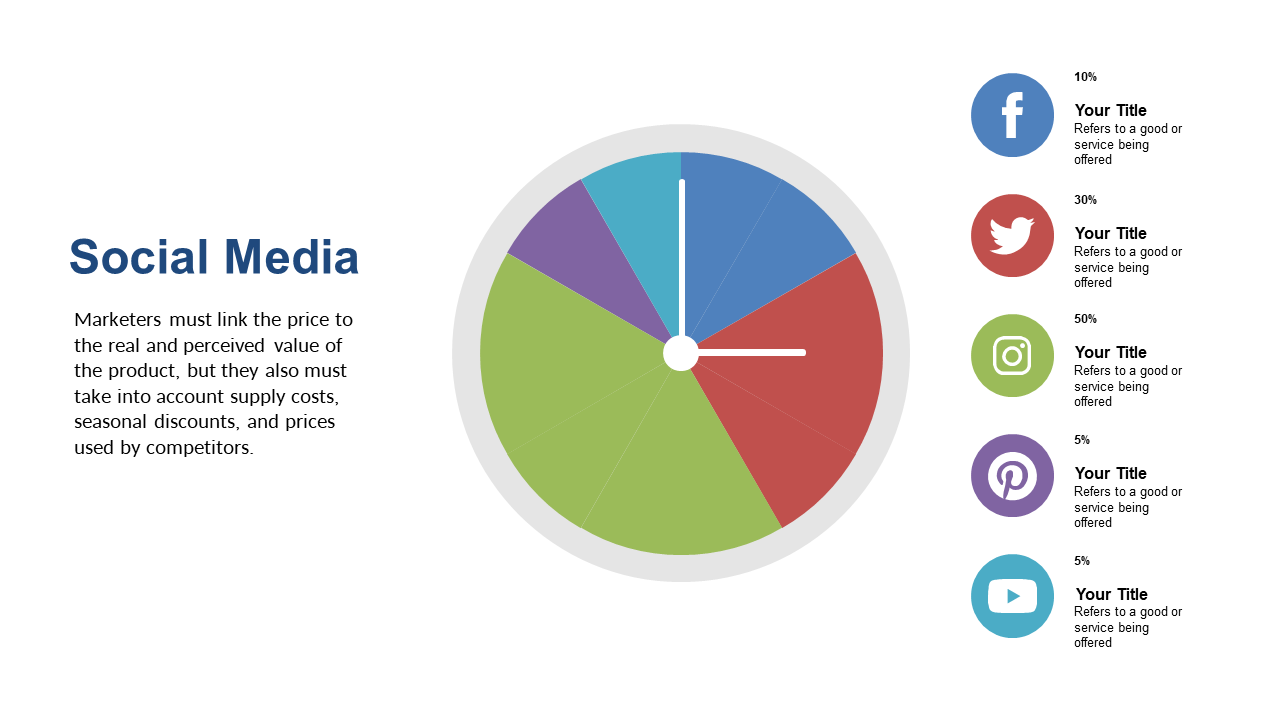
Conveying engagement metrics can sometimes feel like trying to decipher a complex puzzle, especially when you want your team to grasp the key insights without confusion. This editable pie chart simplifies that process, transforming raw data into a clear and visual representation that speaks volumes. You’ll find it easier than ever to highlight the most important findings.
This slide is ideal for marketing analysts, content strategists, and team leaders who are preparing reports or updates for weekly team meetings or strategy sessions. Imagine showing your department an easy-to-read chart that instantly clarifies how your campaigns are performing. Perfect for showcasing social media engagement during a staff meeting or presenting insights to upper management, this slide has you covered.
At just $0.99, this slide can be downloaded instantly and is fully editable in PowerPoint and Google Slides.
You can customize it in minutes, adapting it to reflect your own metrics and branding, making it a valuable addition to your presentation toolkit.
$0.99 – Purchase Checkout
Added to cart







