Present Social Media Engagement with Pie Chart
Product Description
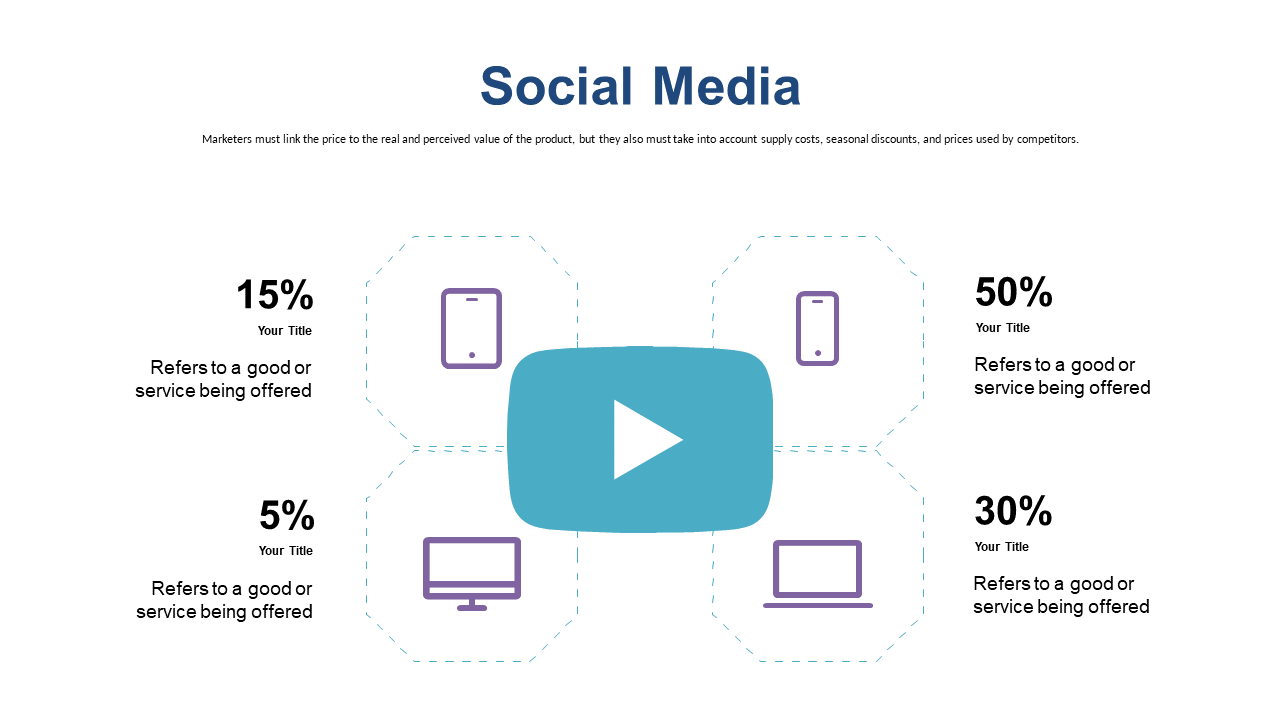
Presenting social media engagement data can often lead to confusion, especially when the numbers are intricate and need to be simplified for your audience. You want to ensure that your insights resonate clearly, and this pie chart slide turns complex metrics into visual representations that your team can easily understand.
Data analysts, social media managers, and marketing professionals will find this slide invaluable for meetings, reports, and strategy sessions. Whether you’re presenting quarterly metrics to your marketing team or analyzing performance trends to your executive board, this slide helps you deliver clear and concise information.
For just $0.99, you get an instant download that’s ready to use in minutes. It’s easily editable in PowerPoint and Google Slides, allowing you to customize it to fit your specific needs without hassle.
$0.99 – Purchase Checkout
Added to cart







