Visualize Social Media Engagement with Pie Chart
Product Description
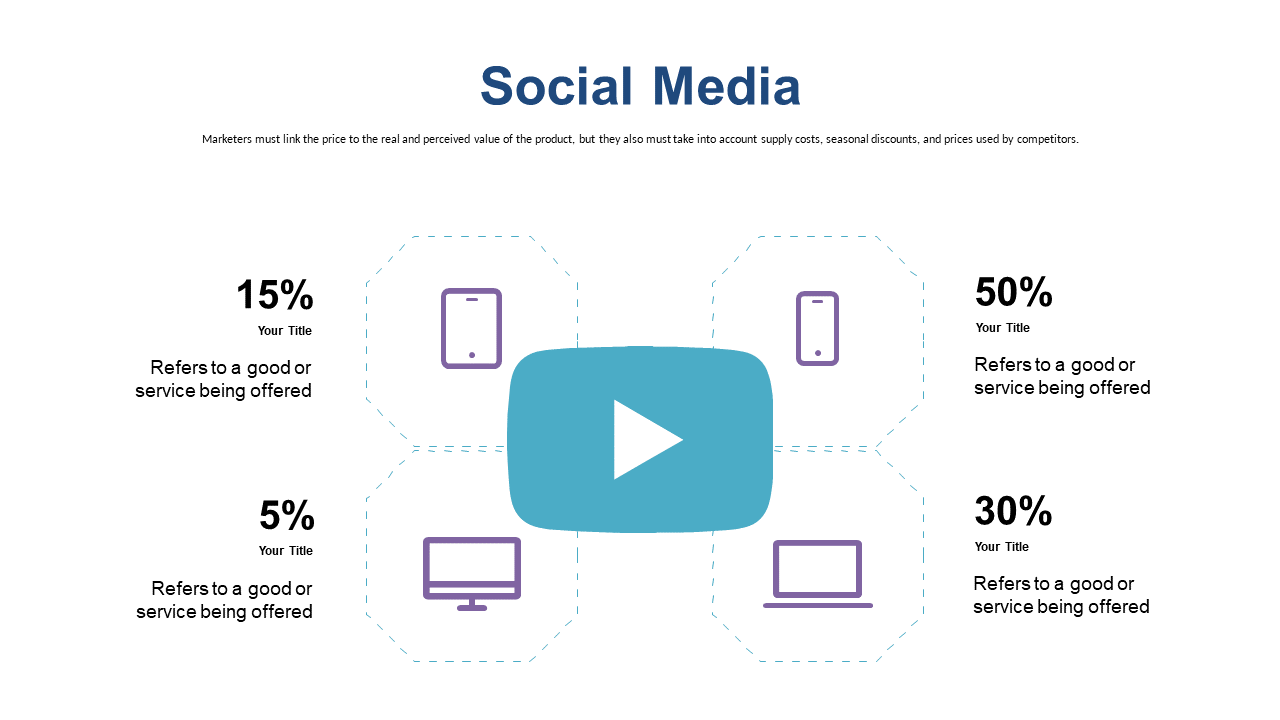
Presenting data on social media engagement can sometimes feel overwhelming, especially when you want to convey intricate details simply. This pie chart slide offers a clear and engaging way to visualize engagement metrics, making it easy for your audience to understand the performance at a glance.
Use this slide as a social media analyst, digital marketer, or content planner during performance reviews or strategy meetings. It’s perfect for showcasing how various posts and campaigns are performing, helping you make informed decisions based on real metrics.
For just $0.99, you can instantly download this slide and have it ready for use within minutes. It’s fully editable in PowerPoint and Google Slides, allowing you to easily adjust the content to fit your specific insights.
$0.99 – Purchase Checkout
Added to cart







