Visualize Sales and Risks with KPI Gauges and Tables
Product Description
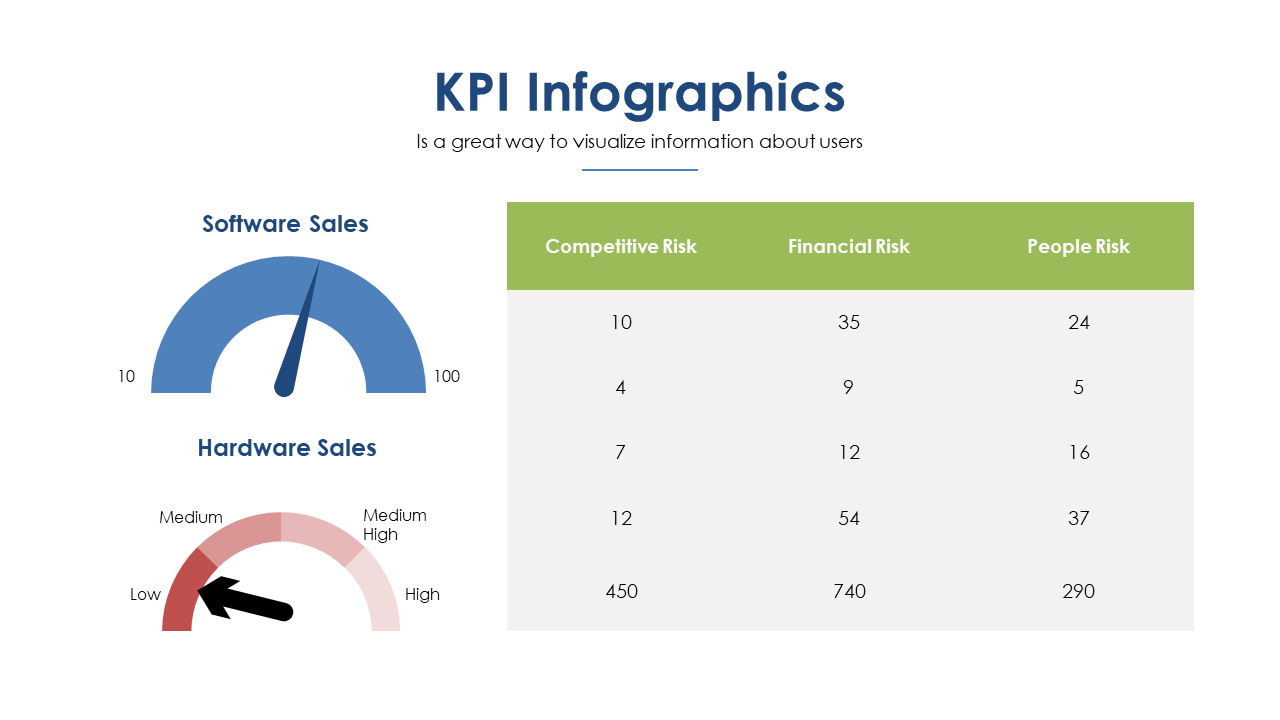
Presenting complex sales data can often leave your audience feeling lost or overwhelmed. You need a way to condense crucial information into a format that drives understanding and action. This slide features vibrant KPI gauges and tables that allow you to effectively visualize sales performance and associated risks.
This slide is perfect for data analysts in sectors like finance or retail, who are tasked with delivering quarterly sales reports. It can also be used by sales managers during team meetings to track progress against targets, or by executives presenting to the board.
The clarity of the visuals will help you communicate critical insights without confusion. For just $0.99, you can download this slide instantly and start editing it in PowerPoint or Google Slides. It’s ready for your personalization in minutes, so you can focus on delivering a compelling presentation.
$0.99 – Purchase Checkout
Added to cart