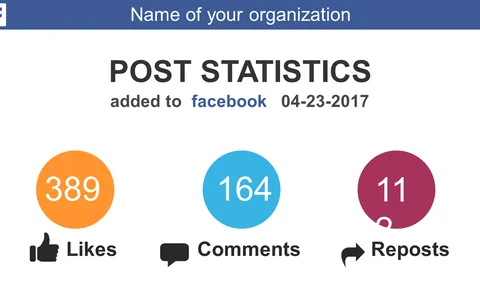
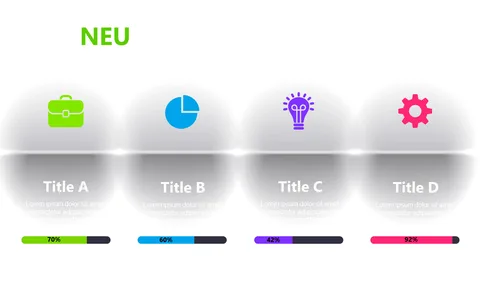
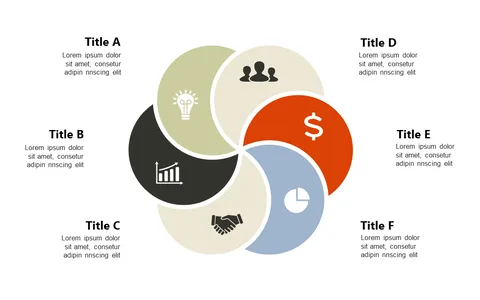
Monitor Performance with Bar and Circular Charts
Product Description
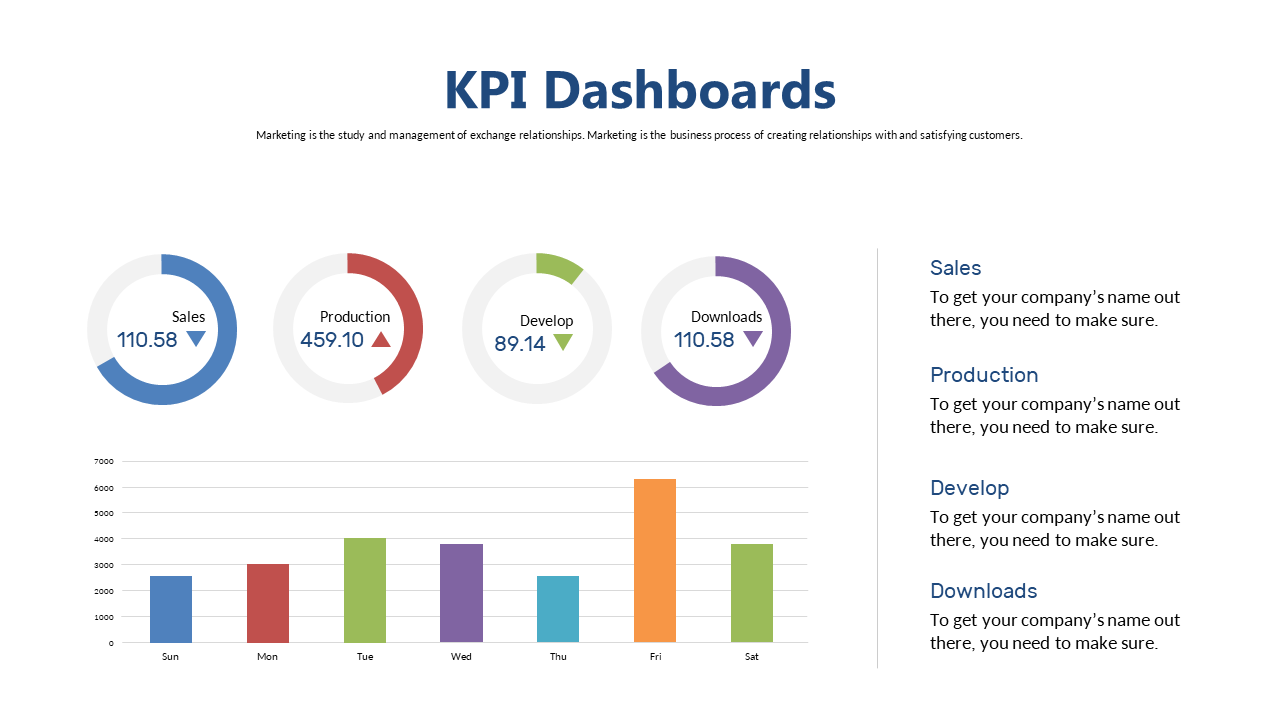
When your data is complex, presenting performance metrics can feel like an uphill battle. This slide integrates bar and circular charts to deliver a clean and intuitive snapshot of your key performance indicators, simplifying the conversation around your data.
Your audience will appreciate the clarity as you break down essential metrics without confusion. You’ll find this slide invaluable if you’re a sales manager reviewing team targets, a project manager assessing project milestones, or even a financial analyst sharing budget performance in monthly meetings. The combination of chart types provides a versatile tool for various industries and occasions, ensuring your message hits home.
Available for only $0.99, this slide is ready for immediate download, allowing you to edit it effortlessly in PowerPoint or Google Slides. Customize the charts to reflect your specific data and make a strong visual impact in no time.
$0.99 – Purchase Checkout
Added to cart