Contrast Current and Future State Strategies
Product Description
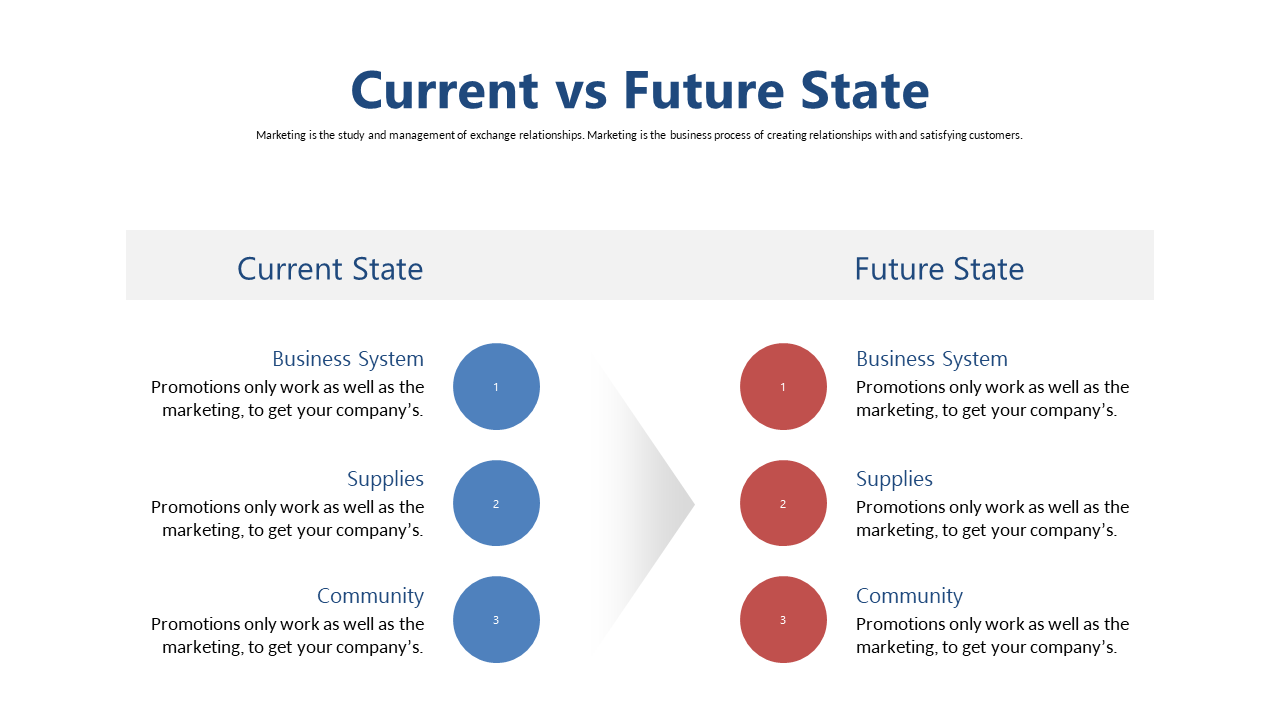
When presenting strategy shifts, making the distinctions between current and future states clear is crucial for gaining buy-in. This slide provides a straightforward way to contrast strategies visually, ensuring that your audience fully grasps the changes on the horizon.
It’s particularly useful for business analysts during quarterly strategy reviews or project leaders explaining new initiatives to their teams. By illustrating these shifts effectively, you can engage your audience and clearly communicate your vision for the future.
For just $0.99, you can download this slide and
easily customize it in PowerPoint or Google Slides. With instant access, you can prepare your presentation in no time.
$0.99 – Purchase Checkout
Added to cart