Effective Comparison of Current and Future KPIs
Product Description
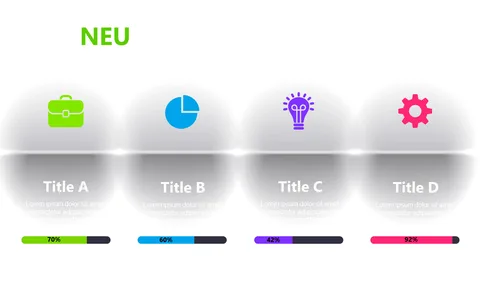
When you’re tasked with demonstrating how KPIs shift over time, clarity is essential. This slide transforms complex data into a straightforward visual narrative, enabling your audience to see how performance indicators have changed and what that means for the future.
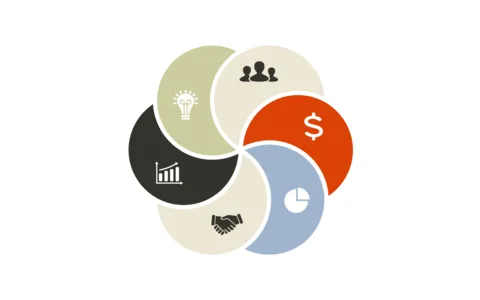
It’s a perfect fit for data analysts presenting findings to marketing teams or operations managers discussing performance metrics in strategy meetings. The hexagonal shapes not only enhance the visual aspect but also engage your audience, making your data compelling and easy to understand.
For just $0.99, you can download this slide and customize it with your specific data in both PowerPoint and Google Slides. You’ll have an eye-catching presentation ready in just a few clicks.
$0.99 – Purchase Checkout
Added to cart