Showcase Growth Progression with Trees
Product Description
Showing growth metrics can often overwhelm your audience, leading to confusion rather than clarity. You want to ensure that your data is communicated simply and effectively, allowing your audience to understand the trends at a glance.
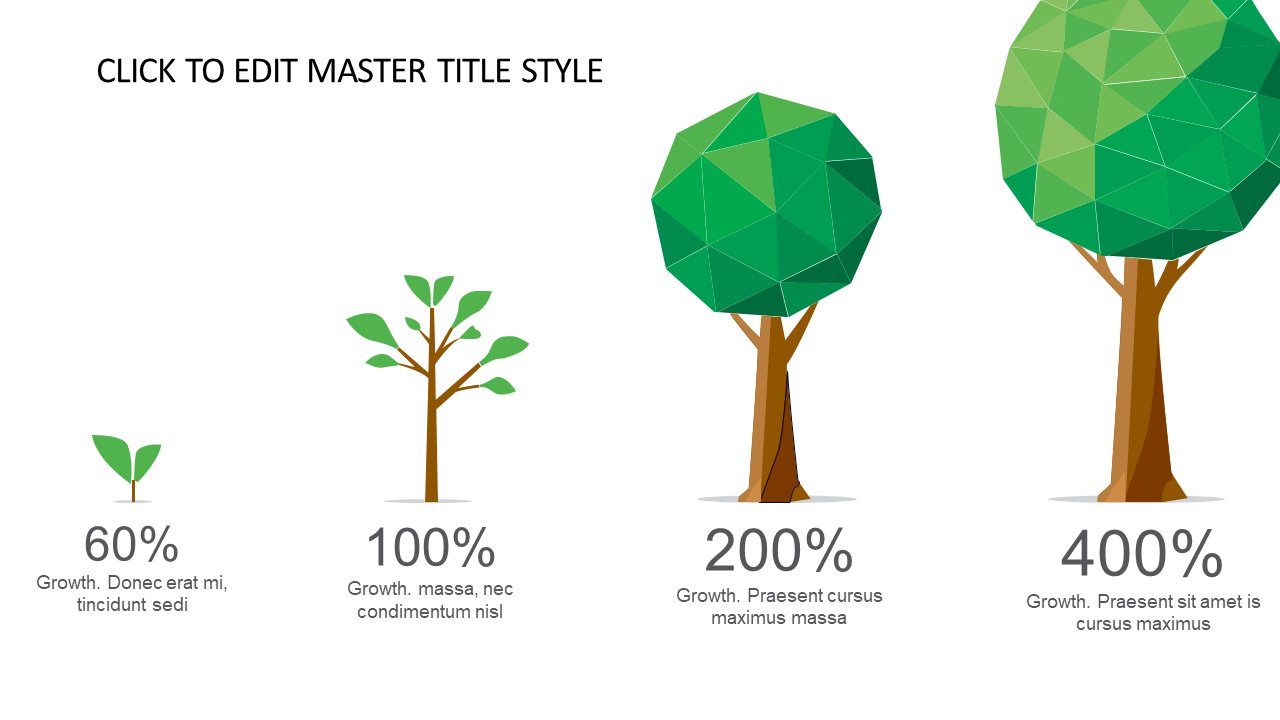
This slide uses tree illustrations to portray growth progression, encapsulating percentage indicators that make your data easy to digest. Use this slide in quarterly business reviews, sales performance meetings, or even during product launches where growth metrics are crucial. It’s perfect for financial analysts, sales managers, or any professionals needing to showcase performance data in a visually compelling manner.
For only $0.99, you can download this slide immediately and edit it to fit your specific needs in PowerPoint or Google Slides. Get ready to present your data in a clear and engaging way without spending hours on design.
$0.99 – Purchase Checkout
Added to cart







