Visualize Feature Comparisons with Computer Mask Chart
Product Description
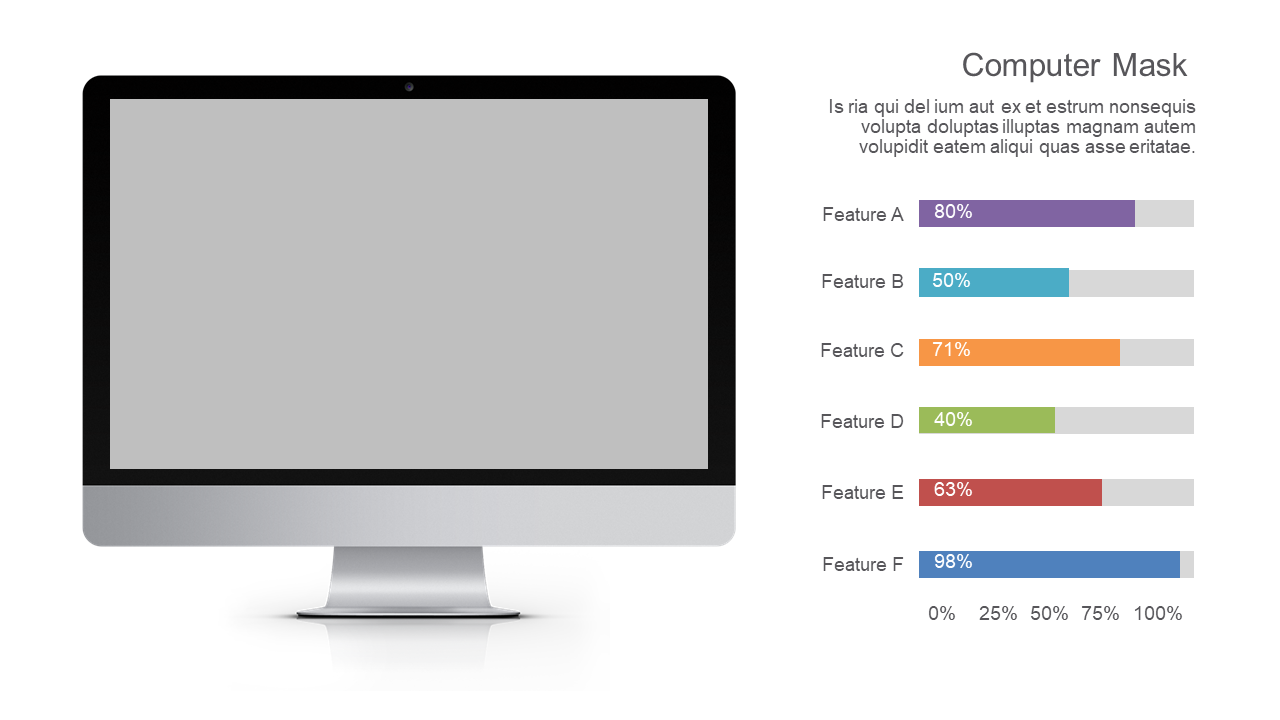
Making complex feature comparisons clear can be a real challenge in presentations. This Computer Mask chart slide simplifies that process, allowing you to communicate feature performance effectively and efficiently without confusing your audience.
Data analysts, product developers, and business consultants will find this slide particularly useful in meetings where data-driven decisions are made. It’s ideal for investor pitches or product review sessions where clarity and precision in data visualization are essential.
You can purchase this slide for just $0.99 and gain instant access to an editable format compatible with PowerPoint and Google Slides. Spend less time worrying about your visuals and more time focusing on your message.
$0.99 – Purchase Checkout
Added to cart







