Data Analysis with Visual Highlights
Product Description
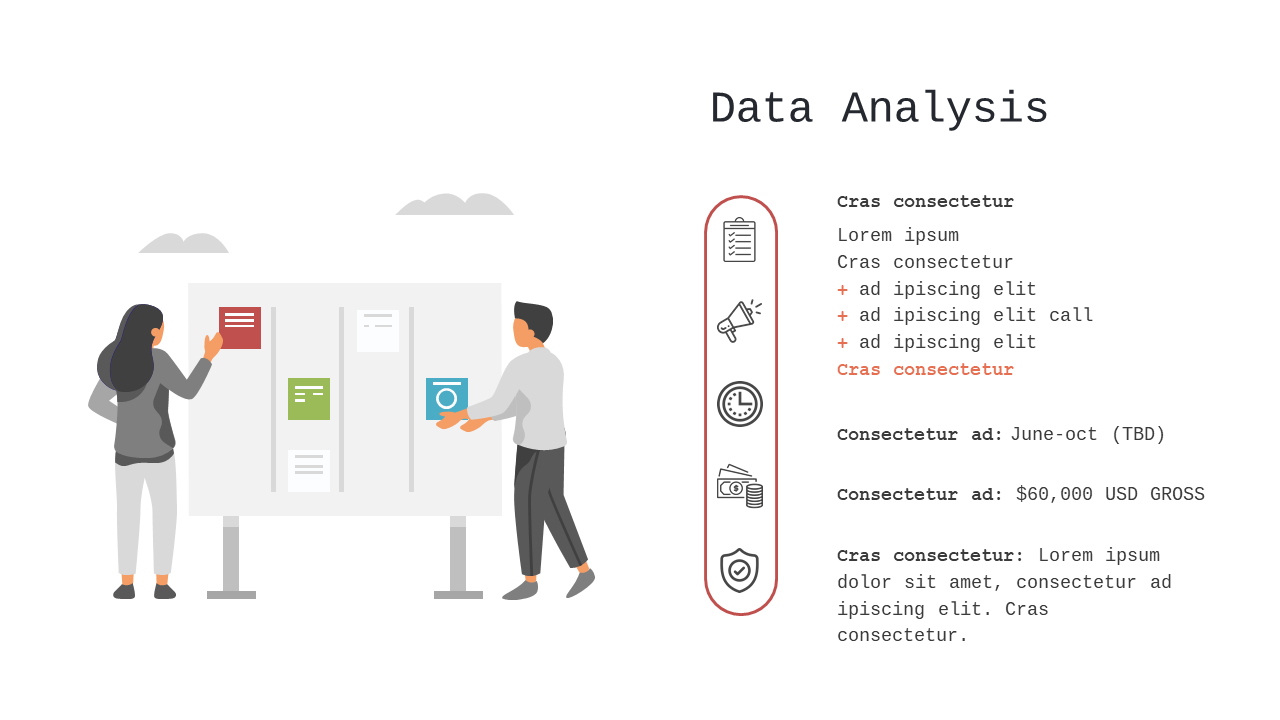
Presenting data insights can be overwhelming, particularly when you want to ensure clarity and focus on key metrics. The Data Analysis with Visual Highlights slide helps you simplify complex information through striking visuals that immediately catch your audience’s attention.
It’s designed to make your data memorable and digestible, so you can communicate efficiently. This slide is ideal for analysts, marketers, or business managers preparing for board meetings, sales pitches, or performance reviews. With this visual aid, you can highlight crucial metrics and trends in a way that resonates with your audience, promoting better understanding and engagement.
For only $0.99, you can download this slide instantly, and it’s fully editable in both PowerPoint and Google Slides. You’ll be set to present your data in a clear, compelling manner in just minutes.
$0.99 – Purchase Checkout
Added to cart







