Compare Data with Circular Percentage Indicators
Product Description
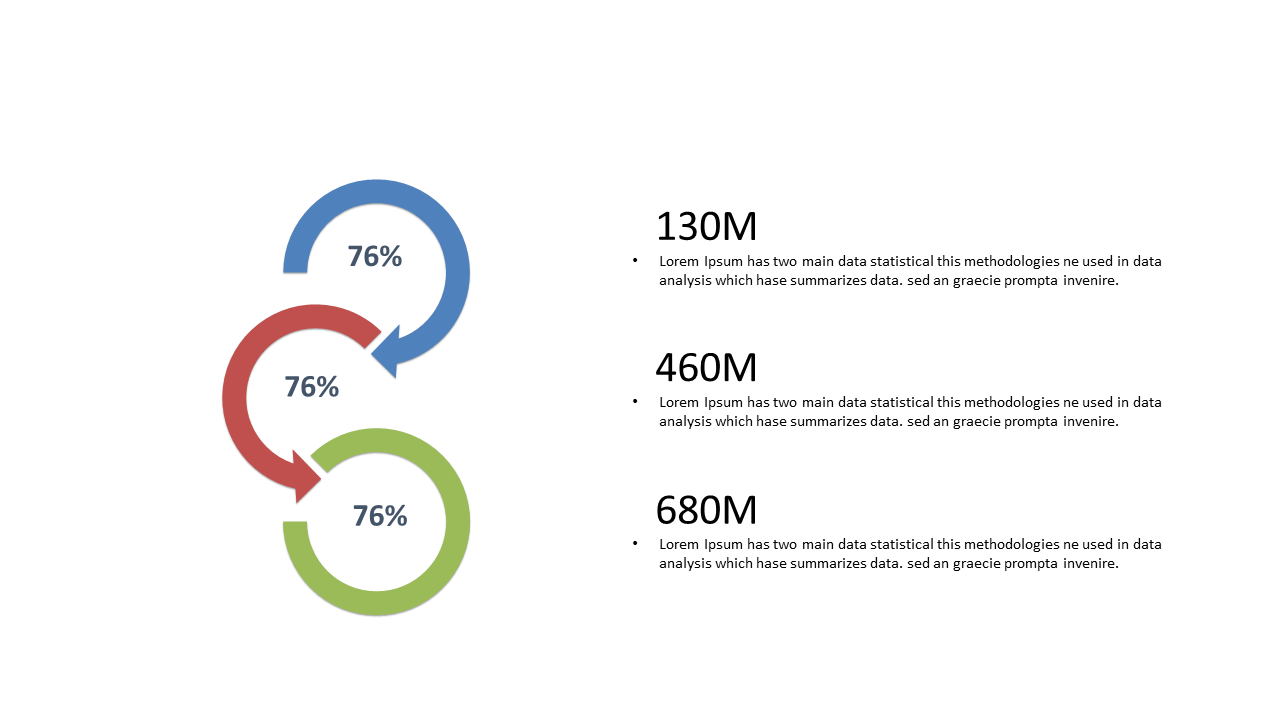
Turning numbers into a compelling story can be tough, especially when you need to convey critical data quickly. The circular percentage indicators on this slide allow you to present complex metrics in a visually engaging way, making it easier for your audience to understand significant differences at a glance. With vibrant visuals paired with clear numerical data, your presentations can truly shine.
Data analysts, marketers, and finance professionals will find this slide especially useful when presenting quarterly reports, market research findings, or performance metrics. Imagine a marketing manager showing campaign effectiveness or an analyst discussing sales growth with this visually appealing format. It grabs attention and makes your data unforgettable.
For just $0.99, you can download this slide instantly. It’s easy to edit in PowerPoint and Google Slides, allowing you to customize the content to fit your specific needs. Get ready to enhance your data presentations in minutes!
$0.99 – Purchase Checkout
Added to cart







