Visualize Yearly Data with Vertical Comparison Chart
Product Description
Illustrating yearly data comparisons can be tricky, especially when you want to highlight trends without overwhelming your audience. You want your visuals to provide insight, not confusion.
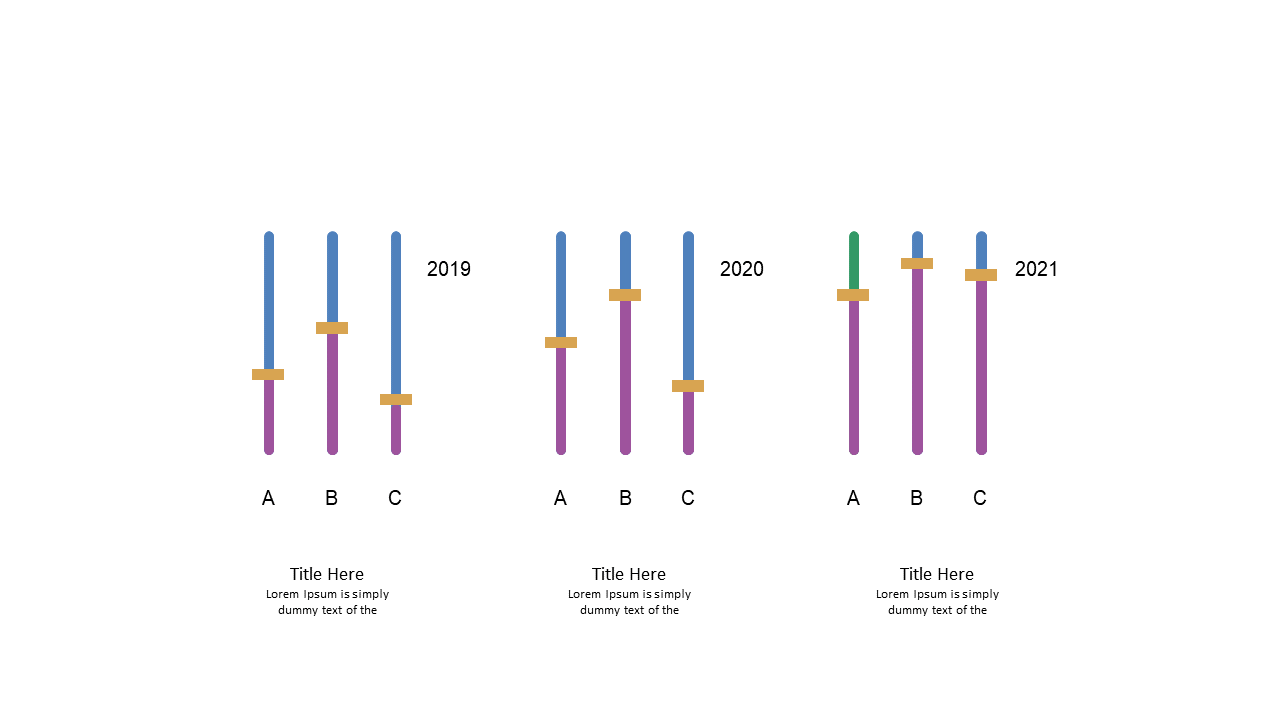
This vertical comparison chart slide makes it easy to showcase data over three years with bold, readable bars that clearly present trends. This slide works wonders for financial analysts presenting yearly performance metrics, as well as marketing managers comparing campaign effectiveness over multiple years. It’s also perfect for educators looking to succinctly display growth in student performance over time during annual reviews.
At the low price of $0.99, you can instantly download this slide and have it ready for your next presentation. It’s fully editable in PowerPoint and Google Slides, enabling you to customize it precisely to your needs in just a few minutes.
$0.99 – Purchase Checkout
Added to cart







