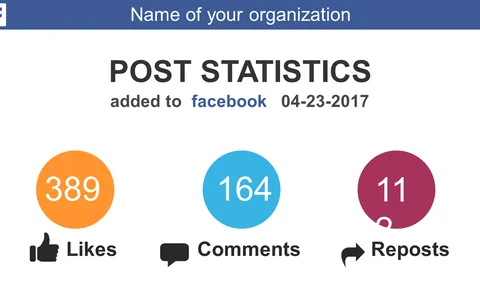
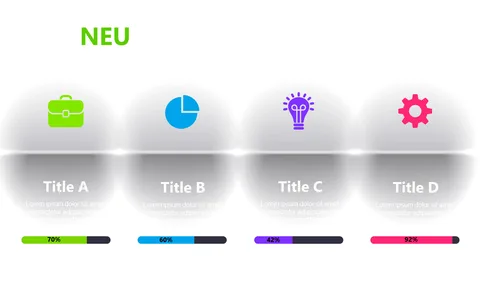
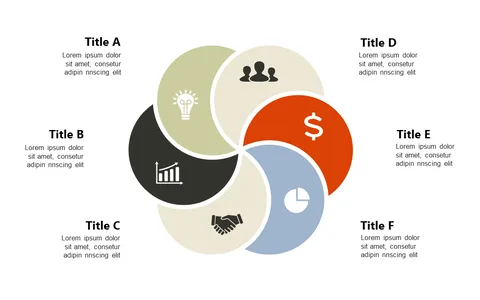
Showcase Key Metrics with Large Percentage Visuals
Product Description
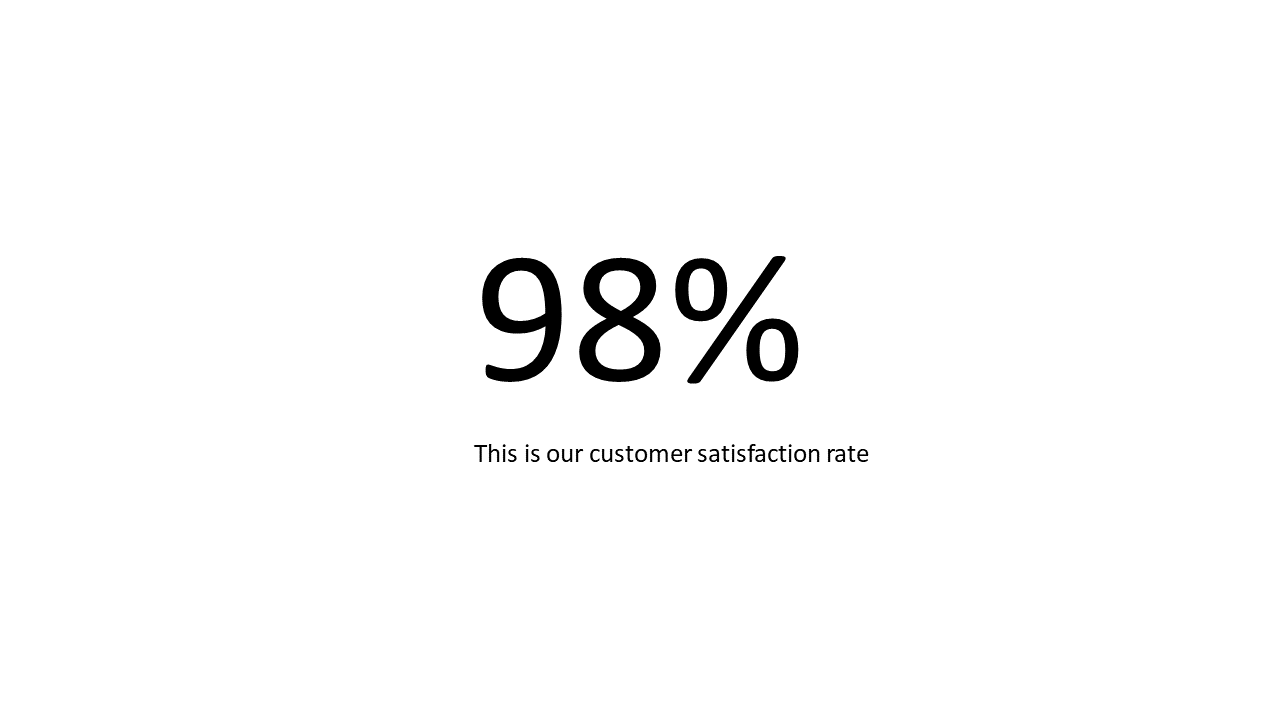
Presenting complex data can be a daunting task, especially when your audience struggles to grasp the key takeaways. This slide simplifies the challenge by showcasing a large percentage figure that draws instant attention, paired with a concise statement that explains its significance.
You get a powerful visual tool that makes it easy for anyone to understand your metrics at a glance. This slide is perfect for finance managers preparing quarterly financial reviews or sales leaders presenting KPI updates in team meetings. Whether you’re in a corporate boardroom or a small team huddle, this design ensures that your key metrics shine, making it ideal for various professional settings.
Available for just $0.99, this slide is ready for instant download and easy to edit in PowerPoint or Google Slides. Customize the text and colors to fit your brand, and you’ll have a striking visual ready within minutes.
$0.99 – Purchase Checkout
Added to cart