Percentage Distribution Slide for Data
Product Description
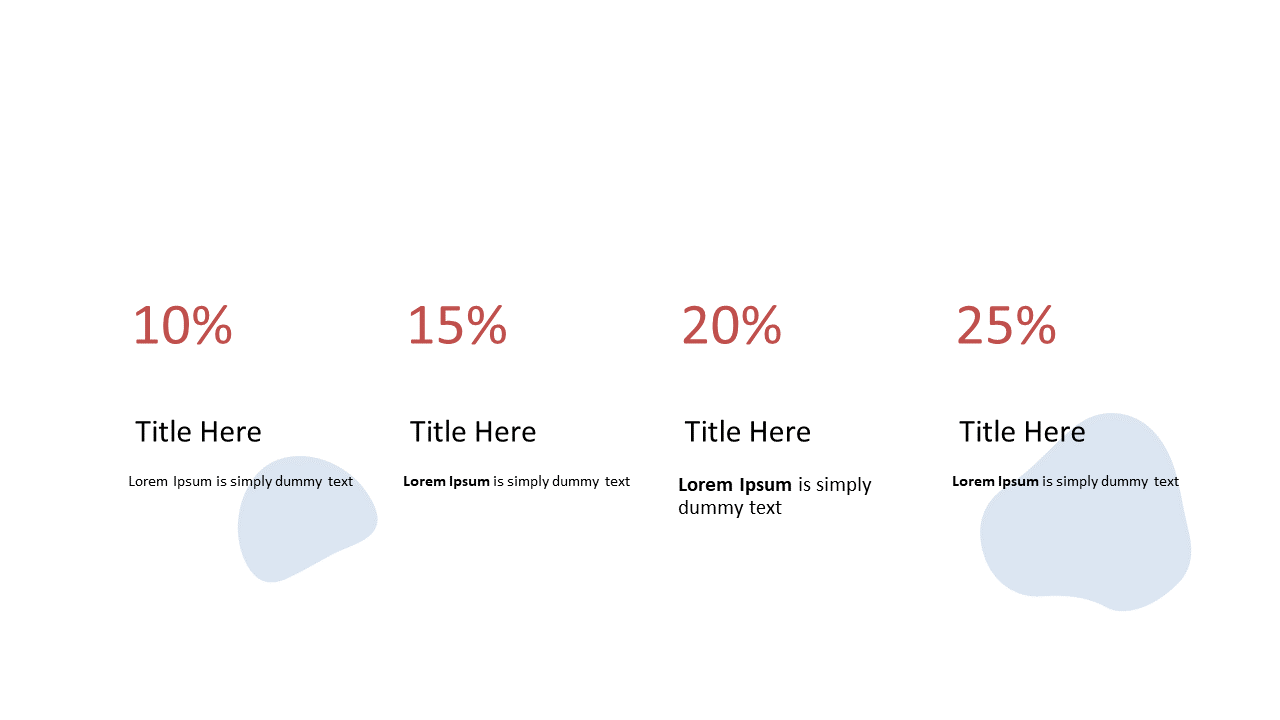
When presenting data in a meeting, it’s common to struggle with making complex information digestible. This slide helps you turn intricate percentage distributions into a clear and visually appealing format that your audience can easily understand.
Instead of losing them in numbers and graphs, you can help them grasp the core insights at a glance. This slide is particularly useful for data analysts and business intelligence professionals who need to present findings in executive summaries or team meetings. Whether you’re sharing quarterly results with senior management or discussing survey responses during a project review, this layout keeps the focus on the data that matters.
At just $0.99, you can instantly download this slide and start making edits in PowerPoint or Google Slides. It’s designed for quick customization, ensuring you can present your data clearly in minutes.
$0.99 – Purchase Checkout
Added to cart







