Analyze Services with Horizontal Bar Chart
Product Description
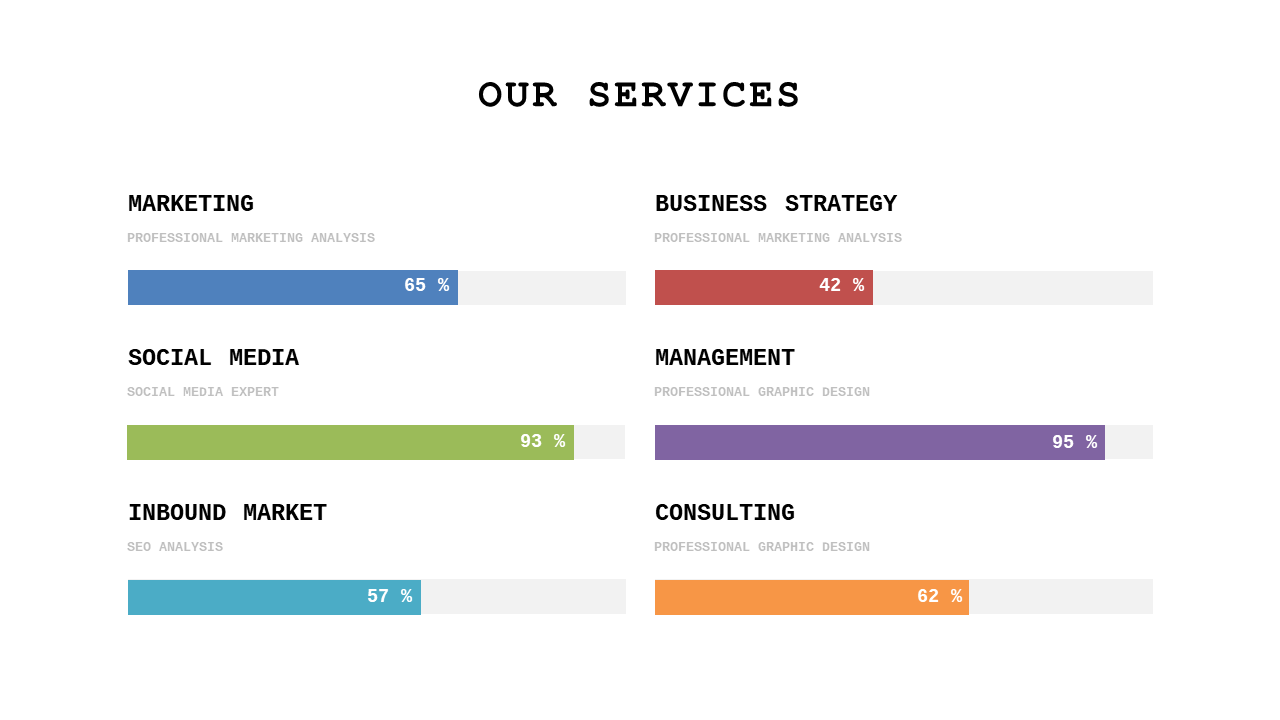
Analyzing service performance often involves complex data that can confuse your audience if not presented clearly. It’s crucial to communicate key metrics in a straightforward way that allows for quick comprehension. This horizontal bar chart slide simplifies data visualization, helping you convey important information without overwhelming your viewers.
This slide is perfect for data analysts discussing service efficiency or project managers reporting on team performance in client meetings. Use it in review sessions or operational assessments where clear data presentation is essential for stakeholders in any industry.
It’s specifically designed for professionals needing to make data-driven decisions. At a price of only $0.99, you can download this slide immediately and customize it in PowerPoint or Google Slides. It’s easy to edit, allowing you to be presentation-ready in a matter of minutes.
$0.99 – Purchase Checkout
Added to cart







