Visual Data Comparisons with Segmented Pie Chart
Product Description
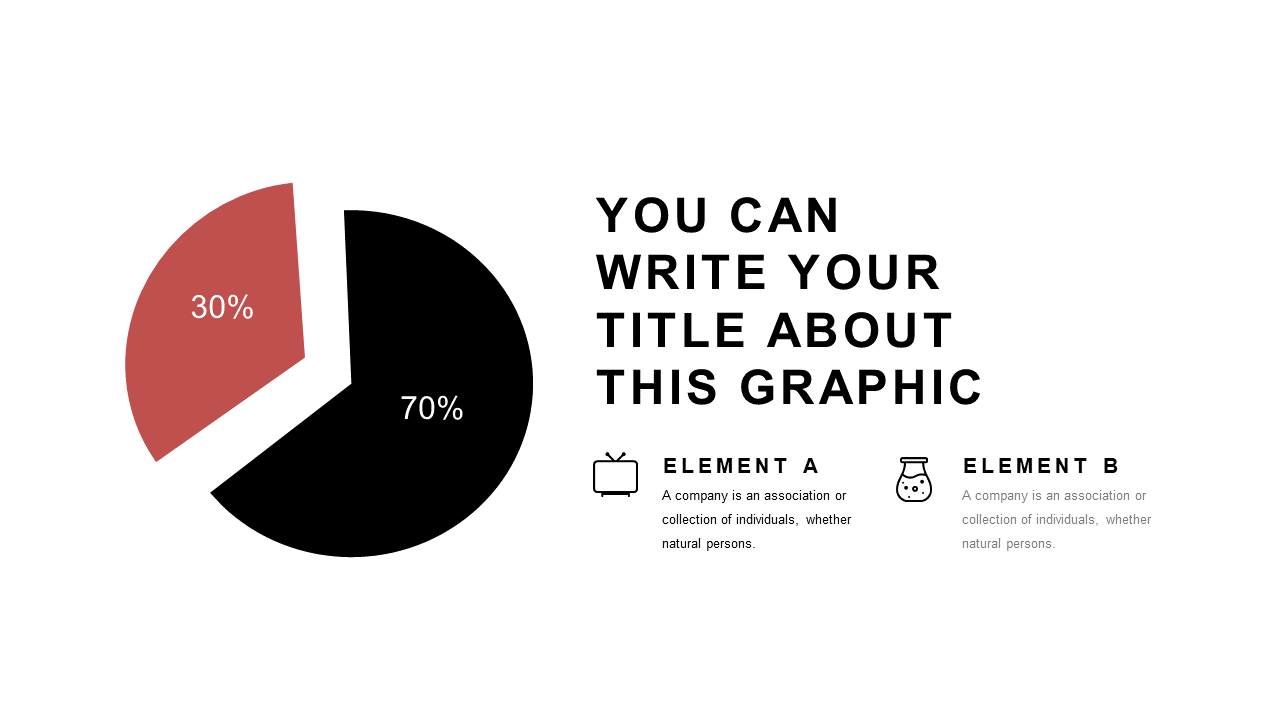
Presenting complex financial data can feel like navigating a maze, especially when your audience struggles to see the key comparisons. A well-designed visual makes it easier to highlight important differences, and the segmented pie chart slide does just that.
It simplifies your message, allowing your viewers to immediately grasp essential insights without getting lost in numbers. This slide is perfect for financial analysts preparing quarterly reports, marketing managers presenting budget allocations, or business developers showcasing revenue split across products. In any setting where clear data representation is crucial, this slide helps to enhance your storytelling by turning intricate figures into easy-to-understand visuals.
For just $0.99, you can download this slide and begin customizing it within minutes. Whether you’re using PowerPoint or Google Slides, it’s designed for effortless editing, so you can focus on delivering your message effectively.
$0.99 – Purchase Checkout
Added to cart







