Highlight Pros and Cons with Balanced Comparison
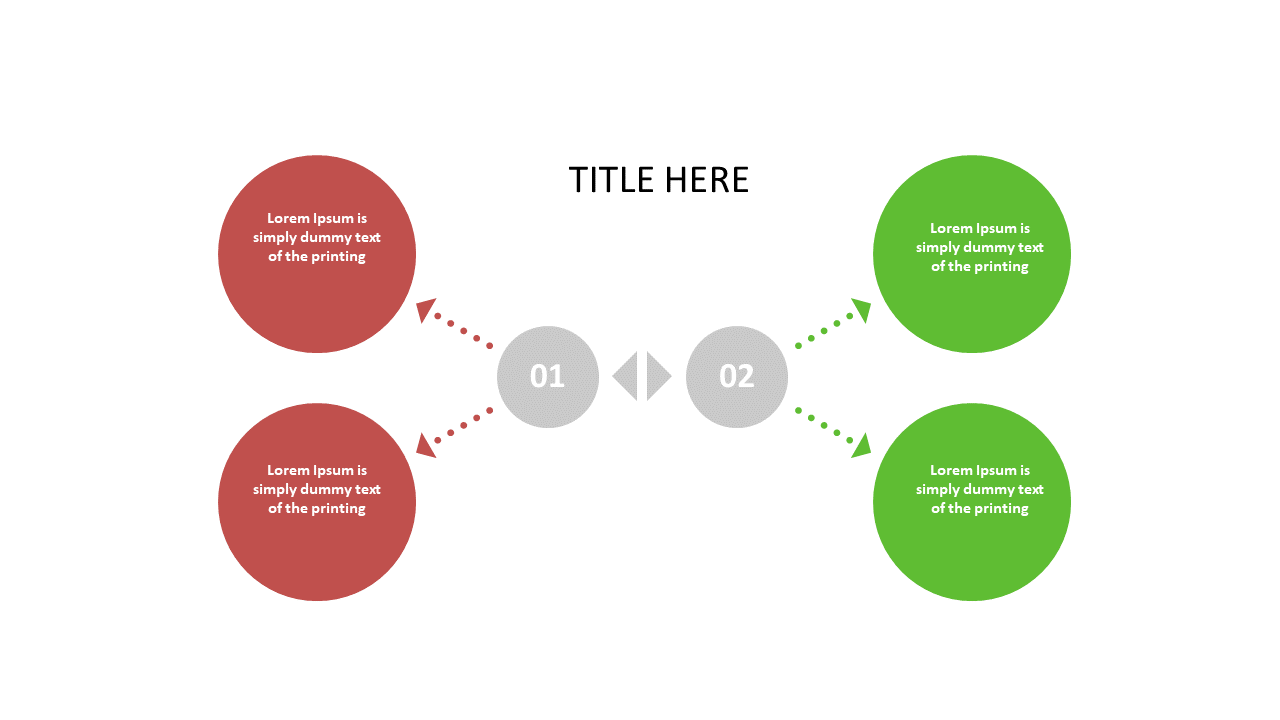
Product Description
Deciding between options can feel like navigating a maze, especially when you need to weigh pros and cons clearly. This balanced comparison slide provides a structured way to present your analysis, allowing you to easily showcase contrasting ideas without overwhelming your audience.
The clarity this slide brings can lead to more informed decisions. Ideal for business analysts dissecting strategies, marketing teams evaluating campaign approaches, or executives making crucial investment decisions, this slide serves multiple roles. Use it in meetings, reports, or proposals to clearly communicate your findings and recommendations.
At just $0.99, you can download this slide right now and edit it quickly to fit your specific needs. It’s compatible with PowerPoint and Google Slides, ensuring you can make changes and present your analysis within minutes.
$0.99 – Purchase Checkout
Added to cart