Summarize Website Metrics with Visual Icons
Product Description
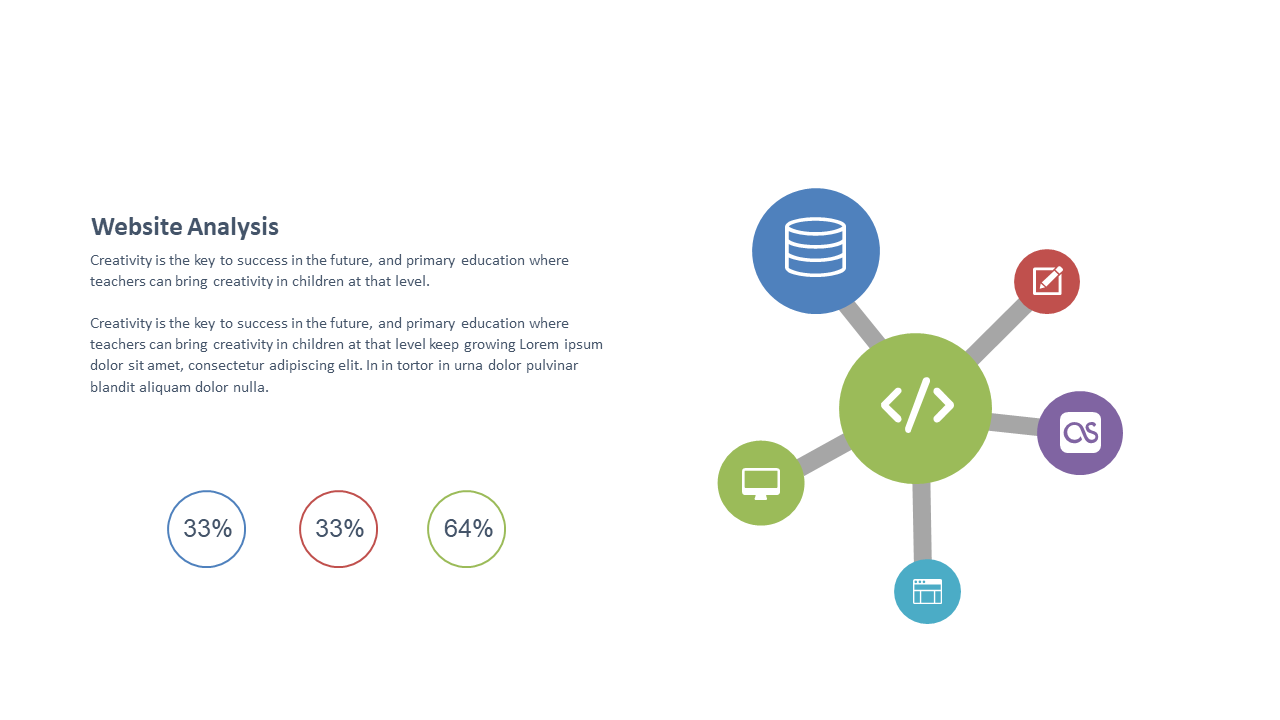
Translating complex website metrics into understandable information can be a tough task. This slide is designed to simplify that process, using clear visual icons to represent various performance metrics around a central analysis icon.
This makes it easier for your audience to grasp the key takeaways. Digital marketers and content strategists can use this slide in monthly performance reviews to showcase site analytics effectively. Web developers might also find it handy for client updates, helping convey technical data in a more accessible format.
You can grab this slide for just $0.99 and have it ready for download right away. It’s editable in PowerPoint or Google Slides, so you can make it fit your needs in no time.
$0.99 – Purchase Checkout
Added to cart







