Showcase Key Insights with Creative Data Layout
Product Description
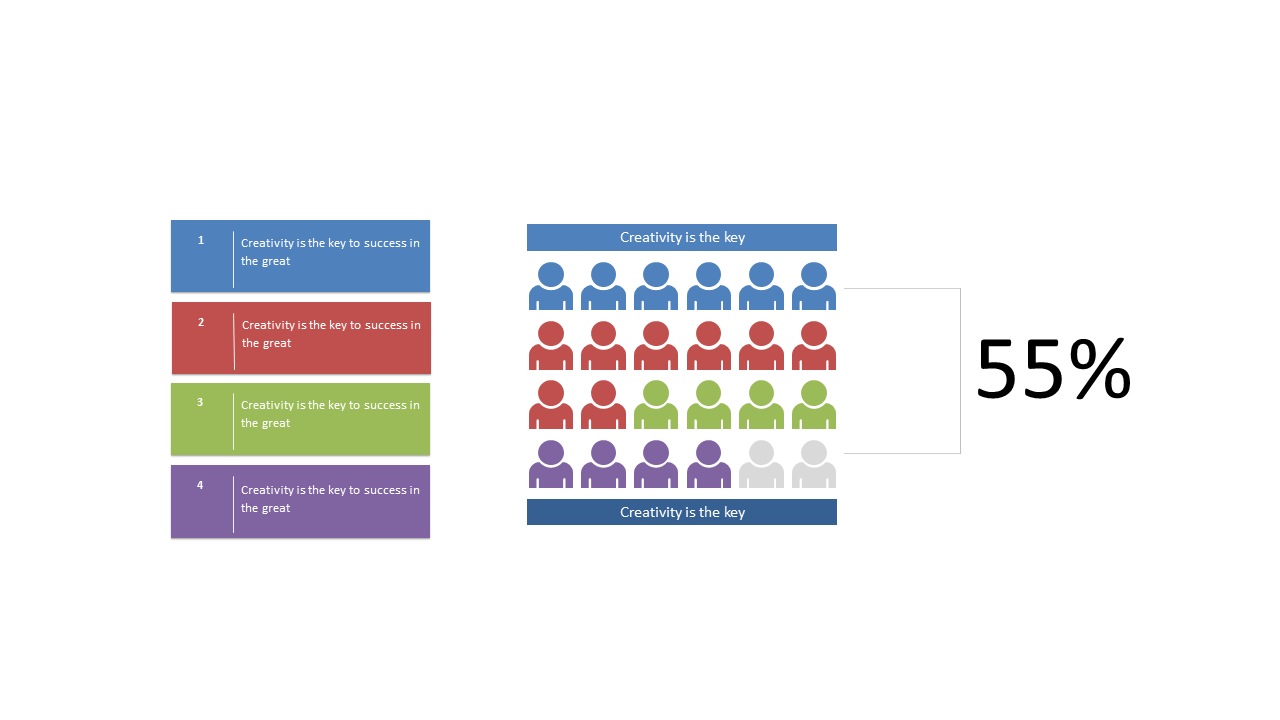
In a world where data overload is common, finding a way to present insights clearly can be a struggle. This creative data layout enables you to showcase important information through a visually engaging design that captures attention.
Say goodbye to cluttered slides and hello to clarity. Data specialists and business analysts can use this slide in team meetings to effectively communicate key performance indicators. Marketing teams can also incorporate it into their reports to illustrate campaign results, making sure essential insights stand out for upper management.
For only $0.99, you can download this slide immediately and customize it in both PowerPoint and Google Slides. Enjoy a hassle-free editing experience while improving your data presentation skills almost instantly.
$0.99 – Purchase Checkout
Added to cart







