Visualize Mental Stats with Brain Graphic
Product Description
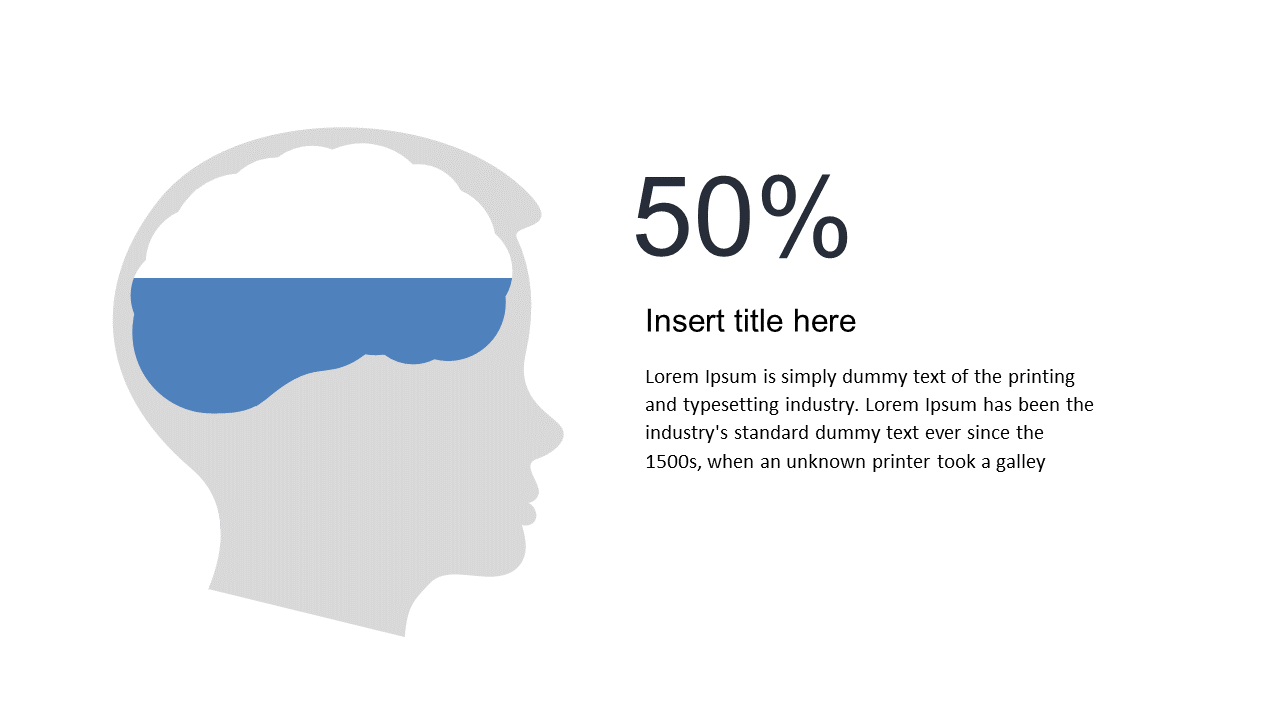
In a world where data reigns supreme, presenting mental statistics can often confuse your audience unless done right. This slide offers a visually appealing brain graphic that highlights important percentages, making it easy for you to share complex data clearly and effectively.
It’s an ideal choice for psychologists delivering research results, marketing analysts showcasing consumer behavior trends, or educators discussing cognitive performance. Whether you’re in a boardroom meeting, a classroom, or a webinar, this slide ensures your statistics make an impact.
For only $0.99, you can instantly download this slide and edit it in PowerPoint or Google Slides. You’ll have a dynamic visual aid ready in no time to enhance your message.
$0.99 – Purchase Checkout
Added to cart







