Showcase Proportional Data with Pyramid Diagram
Product Description
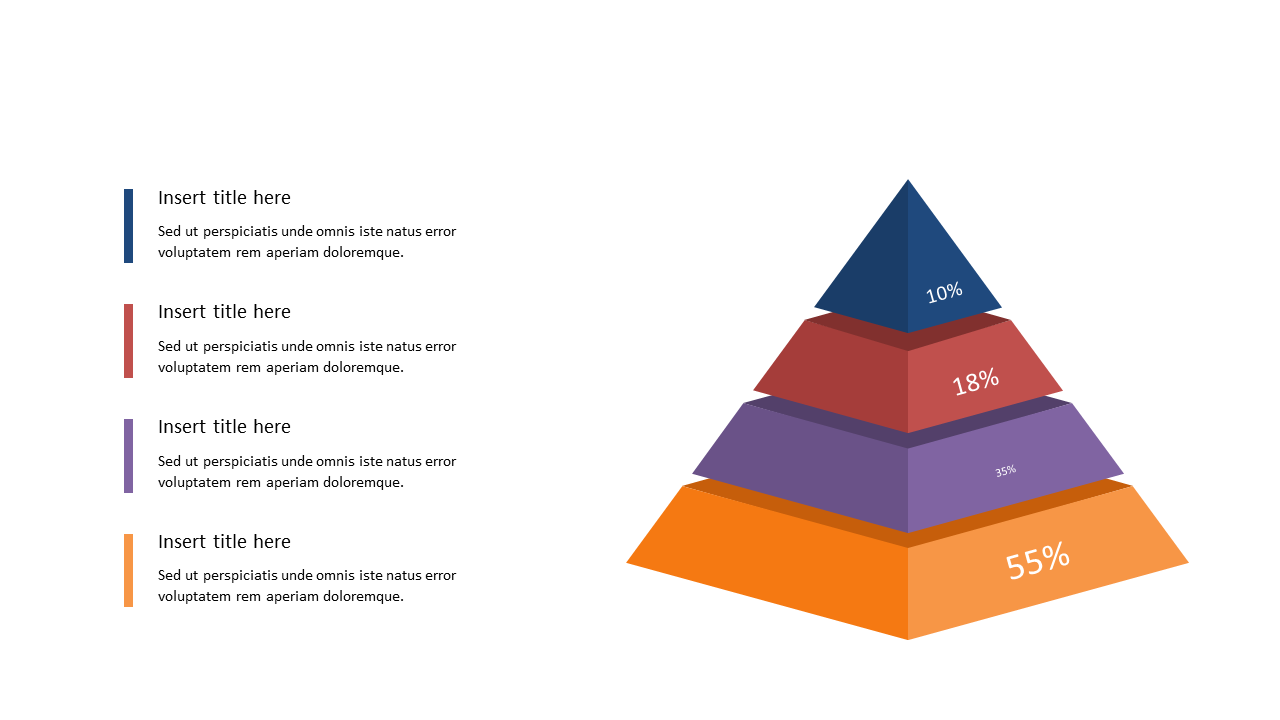
Making sense of complex metrics can feel overwhelming, especially when you want to communicate data clearly. This Pyramid Diagram slide gives you a straightforward way to showcase proportional data, breaking down information into layers that are easy to digest and understand.
Your audience will appreciate the clarity this visual offers. Business analysts and finance professionals will find this slide particularly helpful when illustrating sales data or demographic distributions. Whether you’re presenting to your team in a strategy meeting or sharing insights with executives, this diagram allows you to convey essential data without losing your audience in numbers.
At the price of just $0.99, this slide is available for instant download and can be modified in PowerPoint or Google Slides. It’s designed for quick edits, enabling you to present your data effectively in no time.
$0.99 – Purchase Checkout
Added to cart







