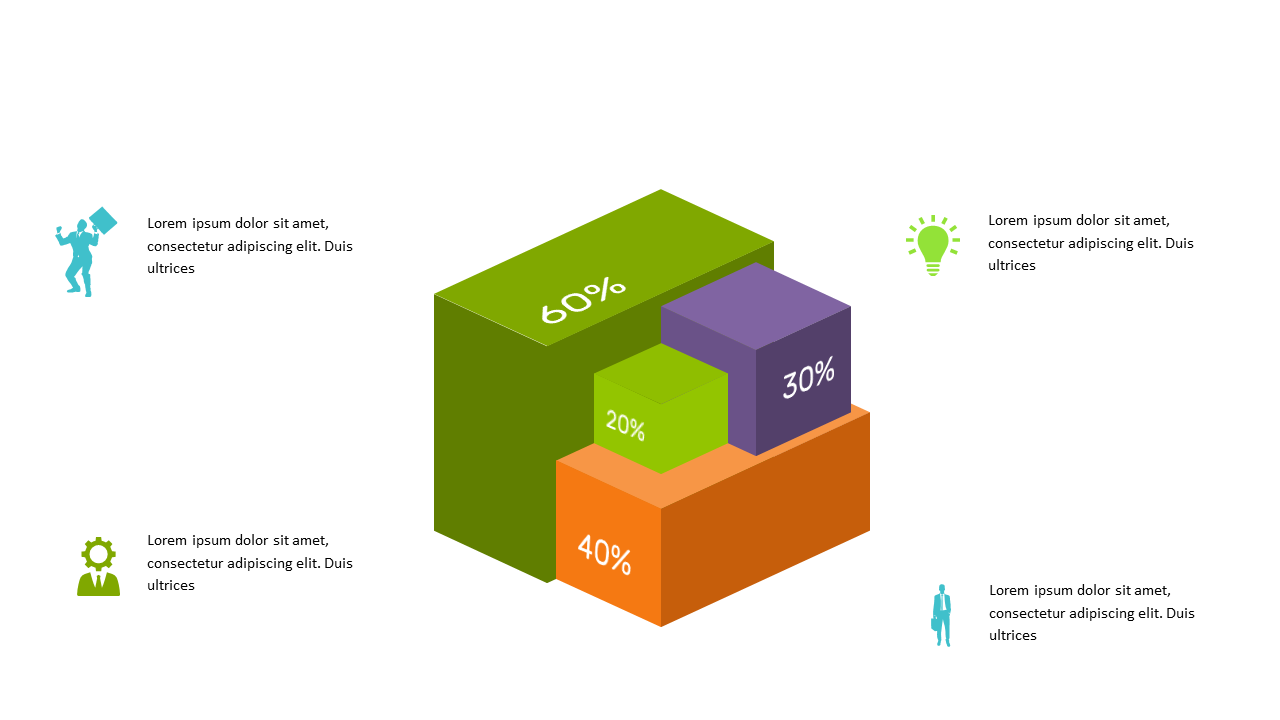
Showcase Data with 3D Percentage Bar Chart
Product Description
Complex data often loses its impact when presented poorly, leaving your audience struggling to understand the key points. A 3D percentage bar chart can transform that data into a visually appealing and easy-to-understand format, making it simpler for your audience to grasp the insights at a glance.
This slide brings clarity to numbers, showcasing your data in a way that captures attention. This slide is perfect for data analysts presenting quarterly reports, executives outlining KPIs in investor meetings, or sales teams showcasing performance metrics. It allows you to communicate vital statistics effectively, making your findings stand out during board presentations or client discussions where clarity is crucial.
You can grab this slide for only $0.99, and it’s ready for instant download. It’s fully editable in PowerPoint and Google Slides, ensuring that you can adjust it to fit your needs without any fuss, so you can focus on delivering your message.
$0.99 – Purchase Checkout
Added to cart







