Triangular Percentage Pyramid for Data Comparisons
Product Description
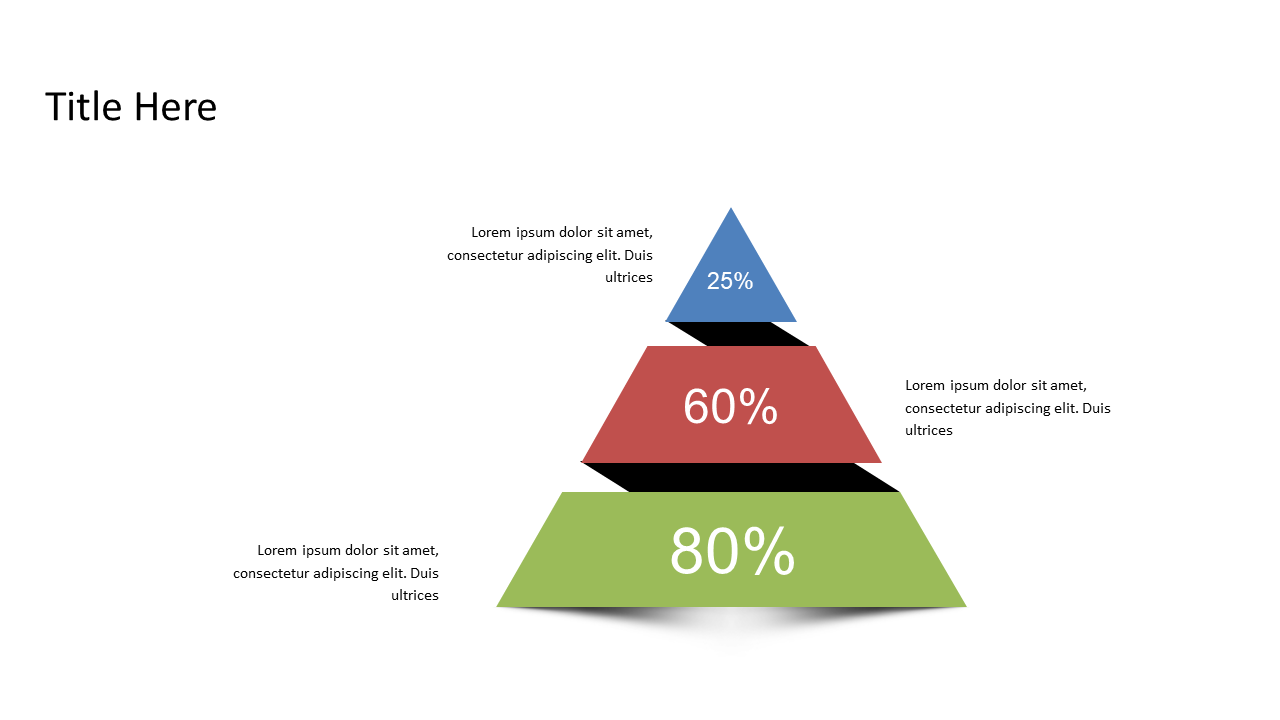
Communicating clear comparisons in a dynamic financial environment can be overwhelming, especially with complex datasets. The triangular percentage pyramid simplifies this process, allowing you to present your data in a visually appealing manner that draws in your audience. By using this slide, you can transform dense information into straightforward comparisons that are easy to understand.
Financial analysts, investment advisors, and budget managers can all benefit from this slide during quarterly reviews, client presentations, or strategy discussions. It’s an excellent tool for those who need to present performance metrics or budget allocations without drowning their listeners in numbers.
Available for just $0.99, this slide is ready for instant download and easy editing.
Whether you use PowerPoint or Google Slides, you can tweak it to fit your unique data and messaging in no time.
$0.99 – Purchase Checkout
Added to cart







