Compare Pharmaceutical Test Results with Table
Product Description
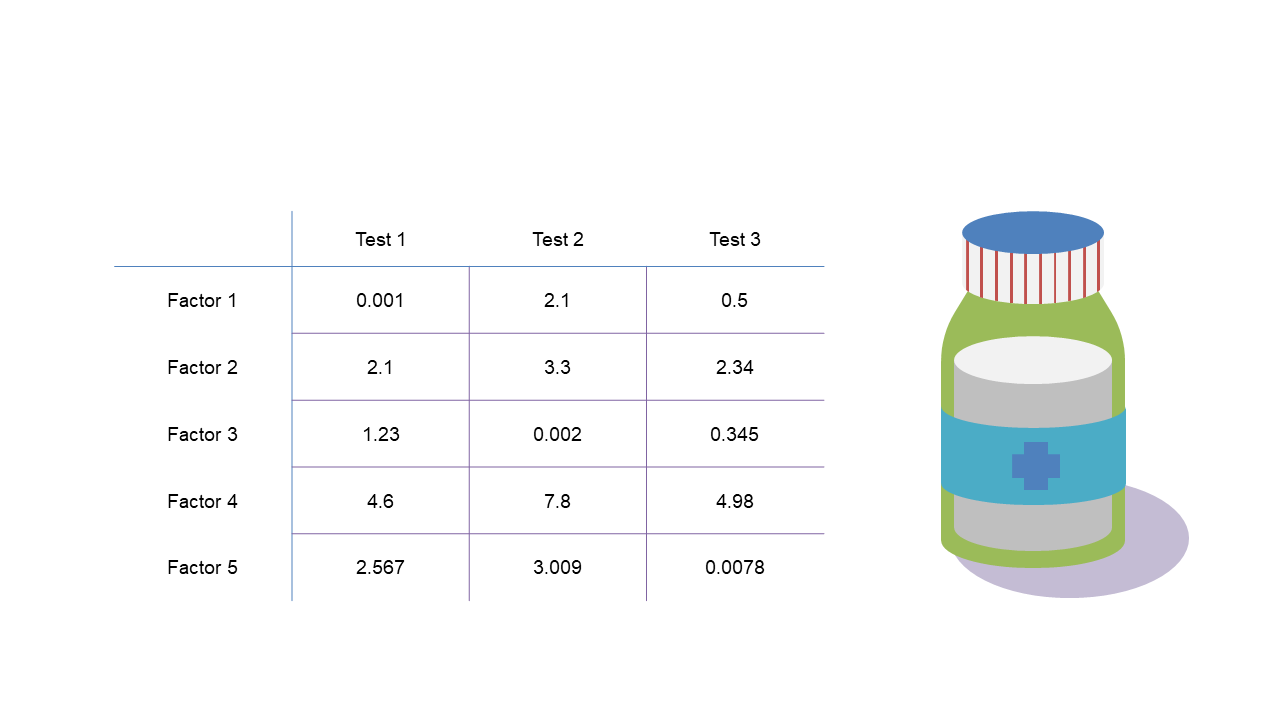
Navigating through dense pharmaceutical test results can be overwhelming for both presenters and their audiences. This slide simplifies that process by providing a clean, structured table alongside a medical graphic, allowing you to present data clearly and effectively without losing your audience along the way.
Ideal for researchers, data analysts, or product managers in the pharmaceutical industry, this slide works well in settings like team meetings, regulatory presentations, or investor pitches. It allows you to compare results in a way that’s both straightforward and visually appealing, making it easier to convey your findings.
For just $0.99, you can download this slide instantly and start editing it right away in PowerPoint or Google Slides. It’s designed for quick customization, so you can focus on delivering your message without the hassle.
$0.99 – Purchase Checkout
Added to cart







