Present Financial Data with Detailed Summary Table
Product Description
Conveying intricate financial data can often leave your audience confused rather than informed. You need a solution that breaks down complex figures into an understandable format without sacrificing detail.
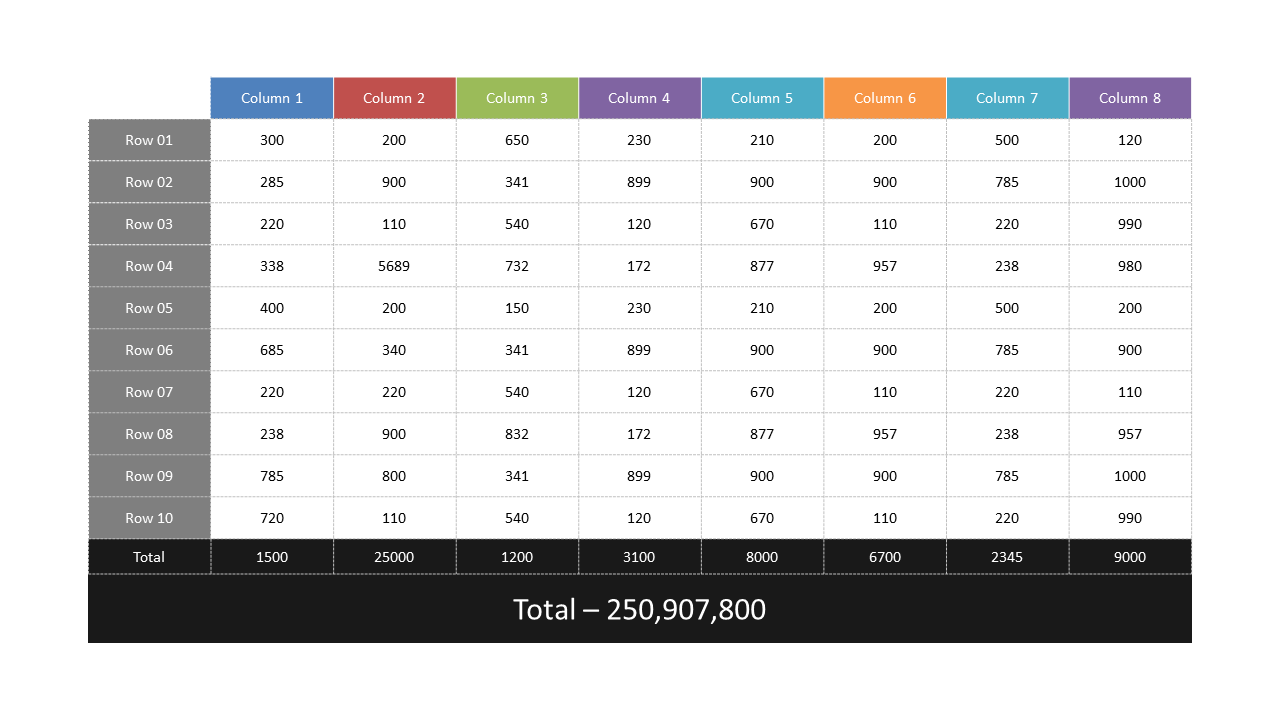
This summary table organizes your financial metrics clearly so your audience can easily digest the information. This slide is perfect for financial analysts presenting quarterly earnings, accountants preparing annual reports, or business owners discussing budget allocations in team meetings. Whether you’re at a board presentation or a client meeting, this table helps you visualize the numbers effectively, ensuring everyone is on the same page.
For just $0.99, you can instantly download this slide and start customizing it in PowerPoint or Google Slides. Editing is a breeze, making it simple for you to tailor it to your specific needs in just minutes.
$0.99 – Purchase Checkout
Added to cart







