Present Data Comparisons with Summary Table
Product Description
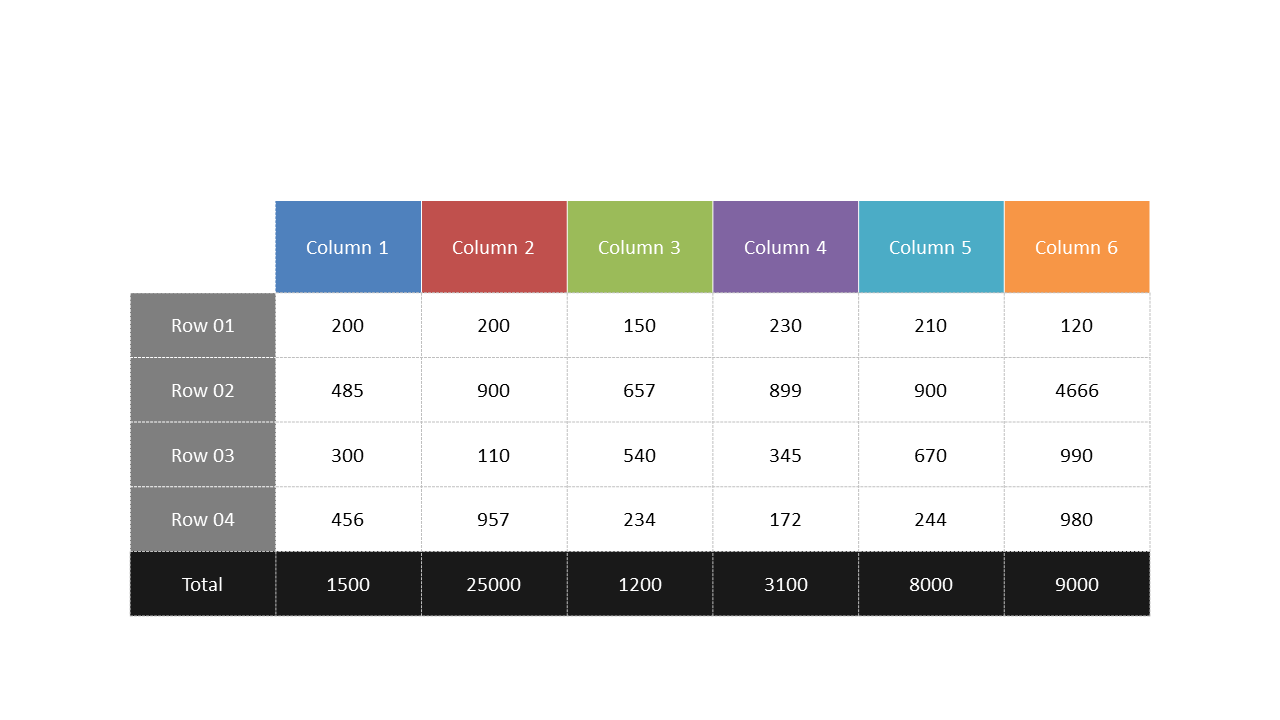
In a fast-paced work environment, effectively presenting data comparisons can significantly impact decision-making. It’s essential for your audience to grasp the information quickly and accurately without feeling overwhelmed. This Summary Table slide meets that need, offering a clean layout that organizes various data points clearly for easy comparison.
Picture a financial analyst presenting quarterly performance metrics, or a project manager comparing the results of different initiatives. This slide is invaluable for anyone in business intelligence, sales forecasting, or any scenario where clear data representation is crucial for driving insights.
It captures essential information while keeping your presentation straightforward and impactful. You can download this Summary Table slide for just $0.99. It’s designed for quick editing in PowerPoint and Google Slides, so you can adapt it to your needs and be presentation-ready in just minutes.
$0.99 – Purchase Checkout
Added to cart







