Analyze Data with Structured Table Layout V2
Product Description
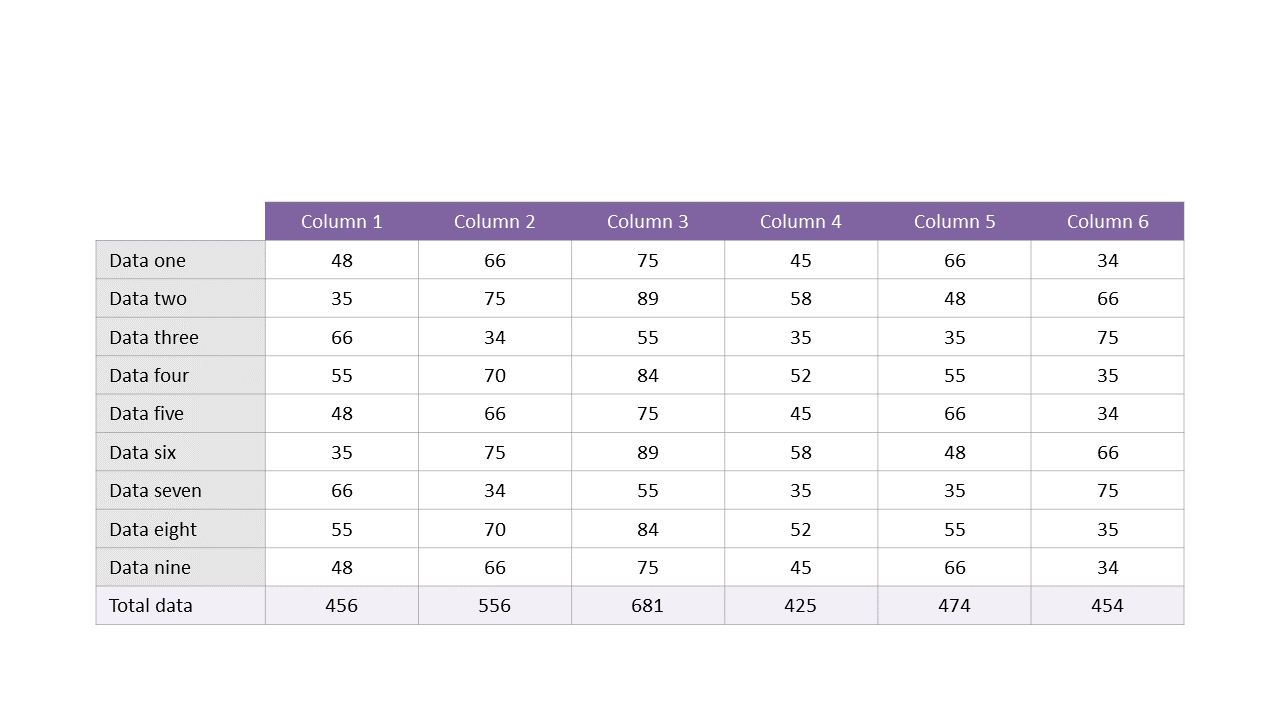
Navigating through extensive data sets can be daunting, especially when your audience struggles to find the key insights. You need a way to present your figures clearly, making them easy to digest. This structured data table layout is designed to showcase your analysis with precision and clarity.
Data analysts and business intelligence professionals will particularly appreciate this slide during quarterly reviews or project kick-off meetings. It’s perfect for communicating trends and metrics in an understandable format, allowing you to highlight critical points without overwhelming your audience.
Whether you’re in tech, finance, or marketing, this slide will make your findings shine. For just $0.99, you can instantly download this slide and start editing it right away in PowerPoint or Google Slides. It’s fully customizable to fit your branding and content needs, ensuring you’ll have it ready for your next presentation in minutes.
$0.99 – Purchase Checkout
Added to cart







