Present Numerical Data with Structured Data Table
Product Description
Conveying numerical data can be tricky, especially when clarity is essential for effective communication. You want your audience to quickly grasp essential comparisons without the confusion of a cluttered layout.
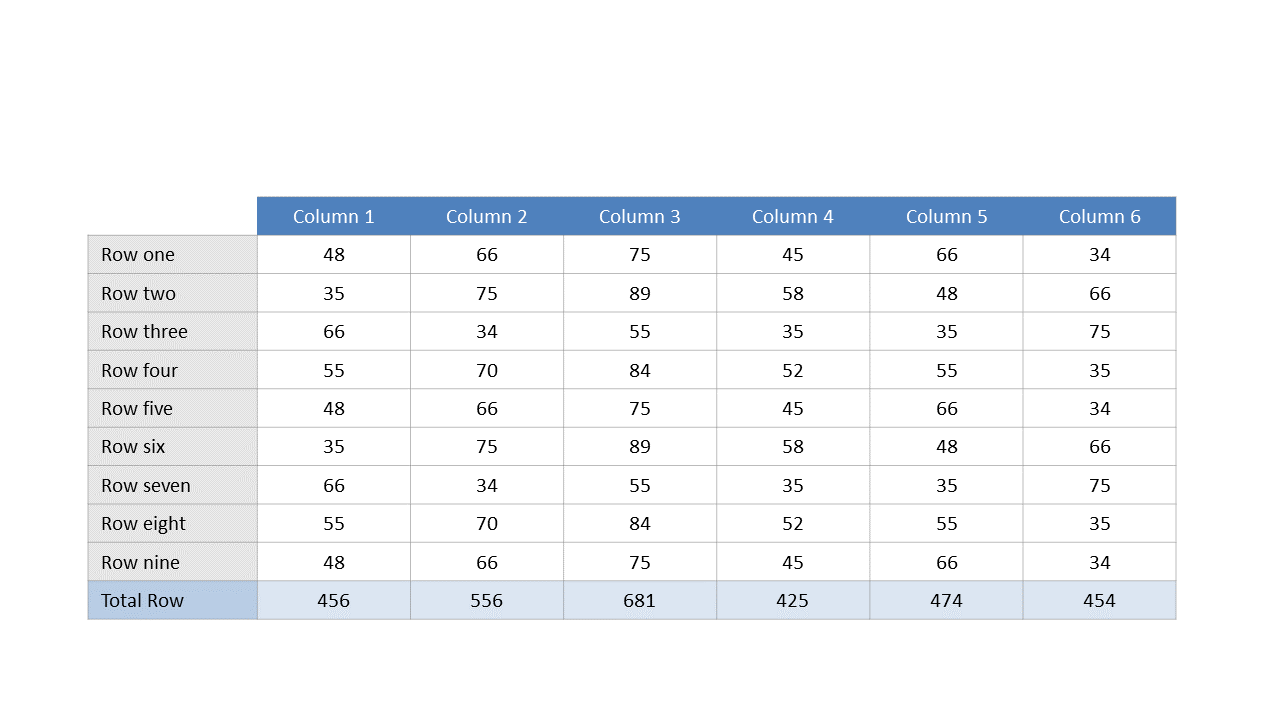
This structured data table helps you present numerical information in a clear and organized way. Data analysts, researchers, and financial planners can benefit from this slide when sharing reports, project analyses, or budget breakdowns. It’s perfect for meetings where concrete numbers need to be showcased, enabling your audience to follow along easily.
For just $0.99, this slide can be downloaded instantly and customized in PowerPoint or Google Slides. Editing is simple, so you can adapt it to fit your specific data needs in no time.
$0.99 – Purchase Checkout
Added to cart







