Visualize Project Performance with Gauge Comparison
Product Description
When it comes to showcasing project performance, capturing your audience’s attention can be challenging. You need a way to make complex data engaging and easy to understand.
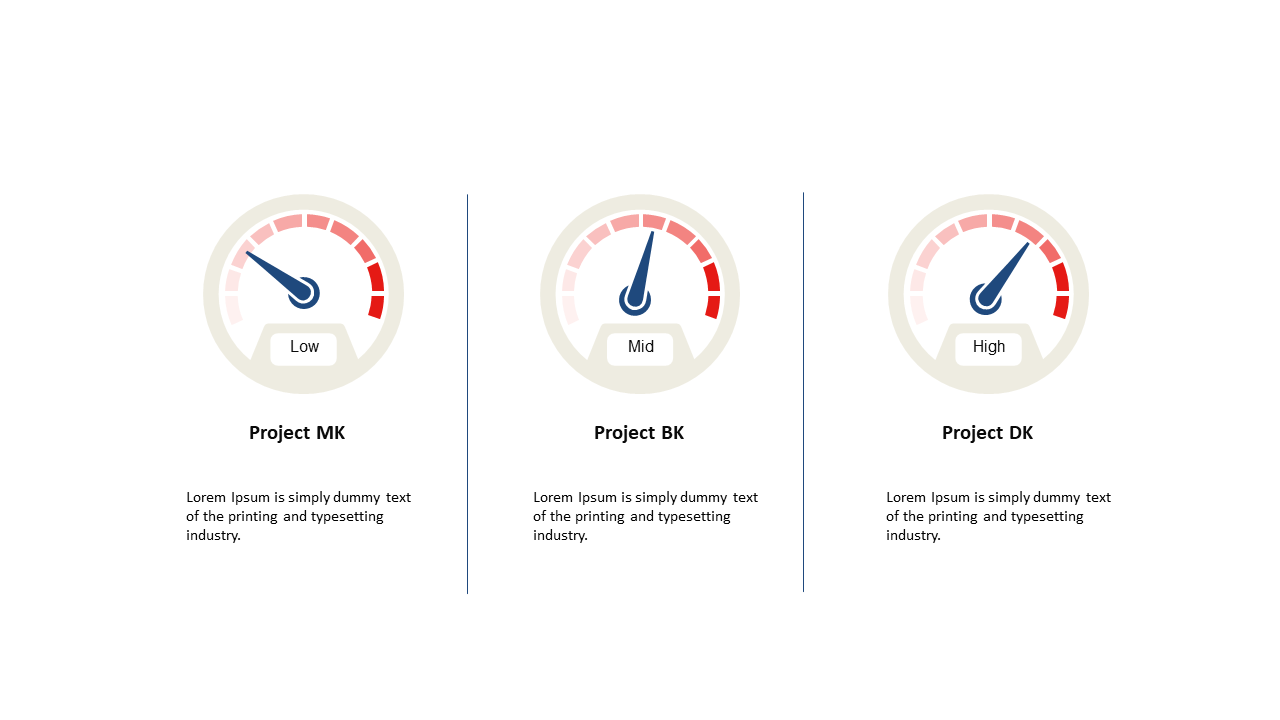
This slide allows you to present project performance through three distinct gauge comparisons, helping convey metrics clearly. Performance managers, analysts, and project leads can make great use of this slide during team reviews, project status meetings, or client briefings. By visually representing performance, you can present your findings in a way that keeps your audience engaged and informed.
For only $0.99, you can download this slide instantly and customize it in PowerPoint or Google Slides. Editing is straightforward, allowing you to focus on delivering your key insights effectively.
$0.99 – Purchase Checkout
Added to cart