Present Sales Data with Pie Chart in Shopping Cart
Product Description
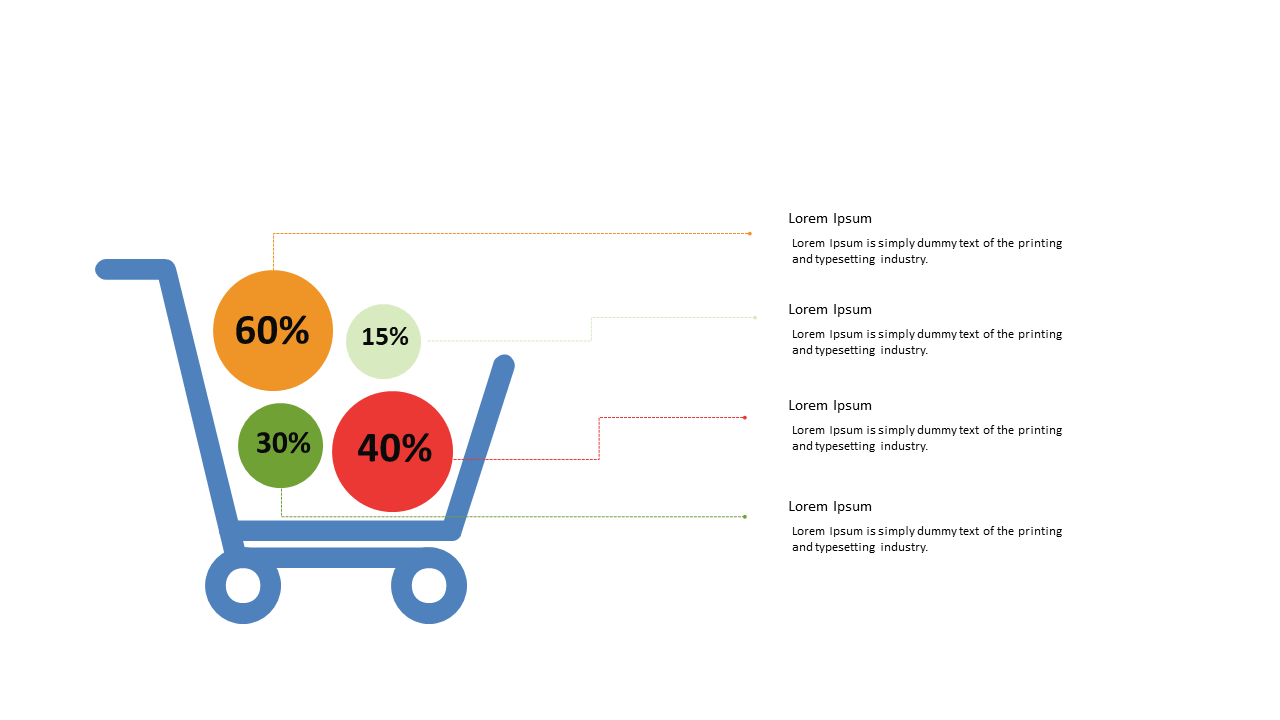
Presenting sales data doesn’t have to be boring or confusing, but it often ends up that way. If you’re struggling to visually represent different sales categories, this innovative pie chart designed within a shopping cart can make your data pop.
It’s an engaging way to share key insights while ensuring your audience comprehends the information quickly. Sales managers in retail, e-commerce professionals analyzing monthly performance, or marketing analysts reporting on campaign results can all benefit from this slide. It’s ideal for quarterly business reviews, sales meetings, and data-driven strategy sessions where you need to illustrate complex data simply and effectively.
Available for only $0.99, you can download this slide immediately and customize it to suit your needs in PowerPoint or Google Slides. Editing is straightforward, allowing you to tailor the content in no time.
$0.99 – Purchase Checkout
Added to cart







