Showcase Trends with Colorful Bell Curve V2
Product Description
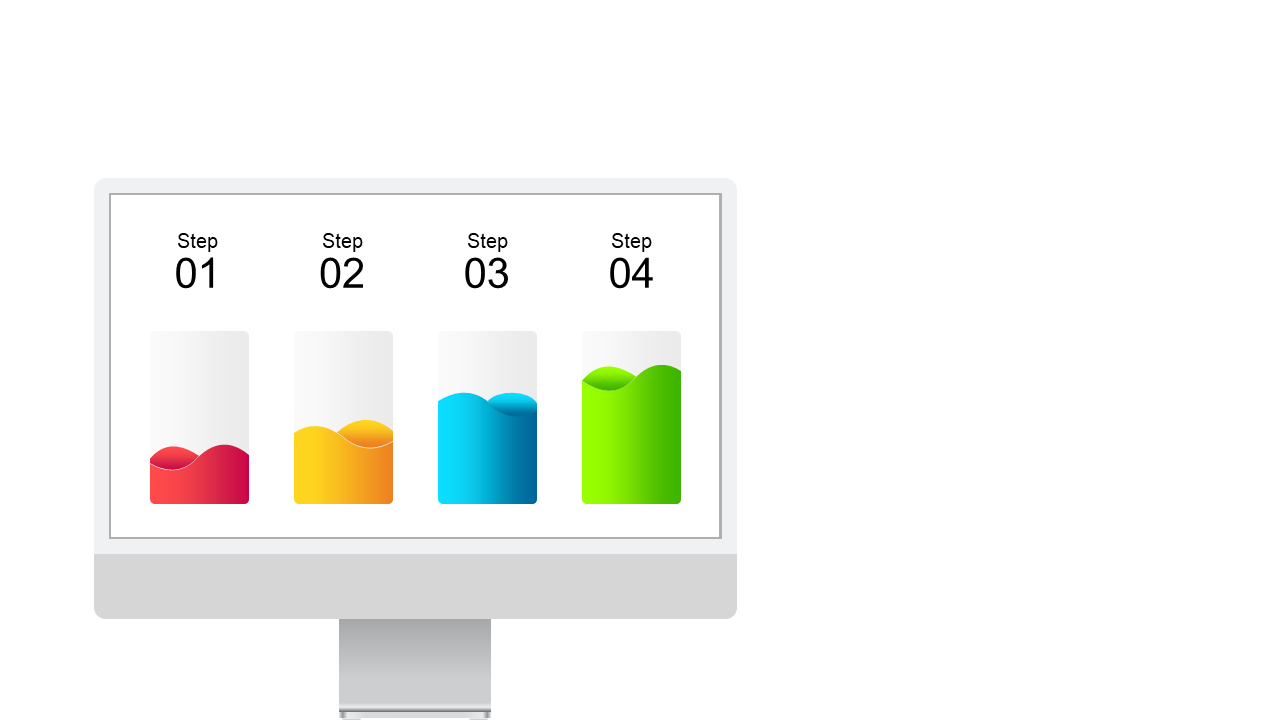
Communicating trends and patterns can be tricky when your data isn’t visually appealing or clear. With this colorful bell curve slide, you can transform your presentations into engaging narratives that your audience can follow without confusion. The eye-catching design simplifies complex information, making it accessible and memorable.
This slide is ideal for marketing managers presenting sales trends during strategy meetings or business analysts reviewing performance metrics in team huddles. It also suits educators illustrating statistical concepts in an engaging way.
Regardless of your industry, this slide makes it easy to convey critical information effectively. For just $0.99, this vibrant slide is available for instant download, letting you customize it quickly for your specific needs. It works perfectly in both PowerPoint and Google Slides, so you can make adjustments with ease.
$0.99 – Purchase Checkout
Added to cart







