Showcase Performance Metrics with Circular Indicators
Product Description
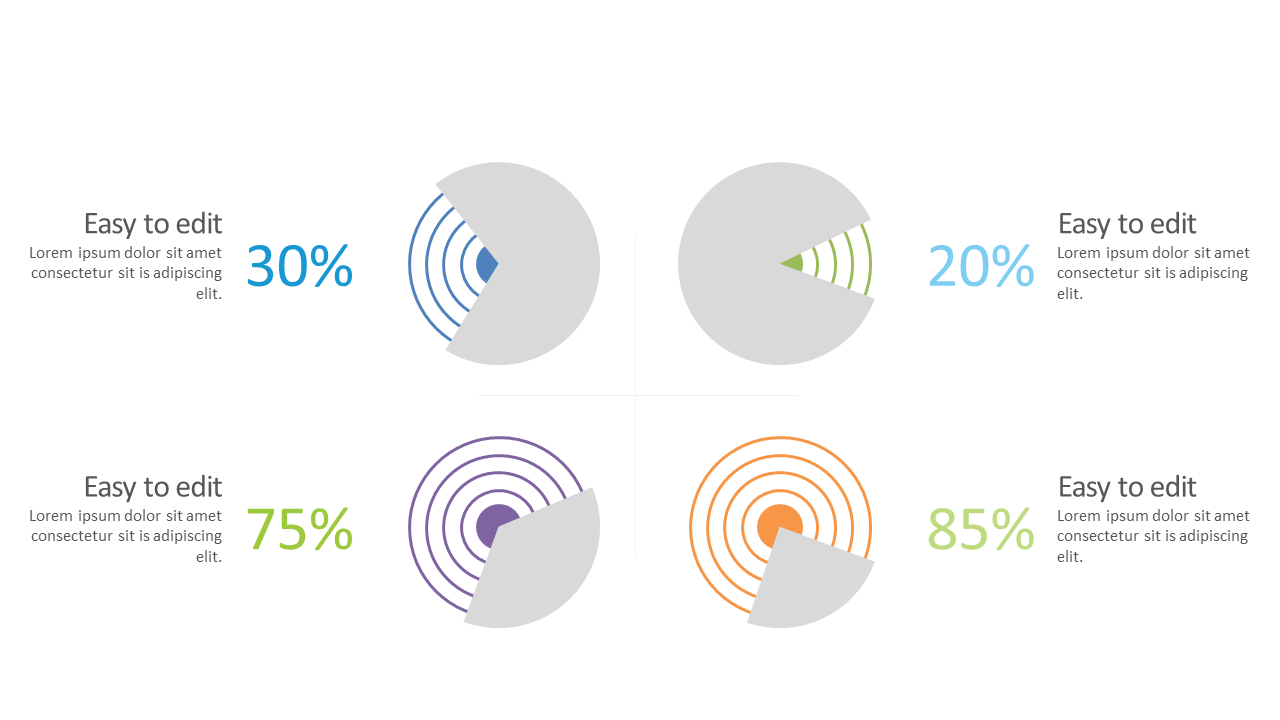
In a world where attention spans are short, conveying complex performance metrics effectively is a must. This slide provides a visually engaging way to present your data using circular indicators that clearly illustrate your key metrics.
Say goodbye to dense text and confusing charts; this slide captures your audience’s attention and helps them grasp important information quickly. Relevant for data analysts, project managers, and sales teams, this slide can be used in performance reviews, project kickoff meetings, or client updates. By showcasing performance metrics clearly and attractively, you enable better understanding and discussion, ensuring everyone is on the same page.
You can grab this slide for just $0.99, and it’s ready to download immediately. It’s fully editable in both PowerPoint and Google Slides, allowing you to tailor it easily to fit your specific data and presentation style.
$0.99 – Purchase Checkout
Added to cart







