Visualize Performance with Quadrant Layout
Product Description
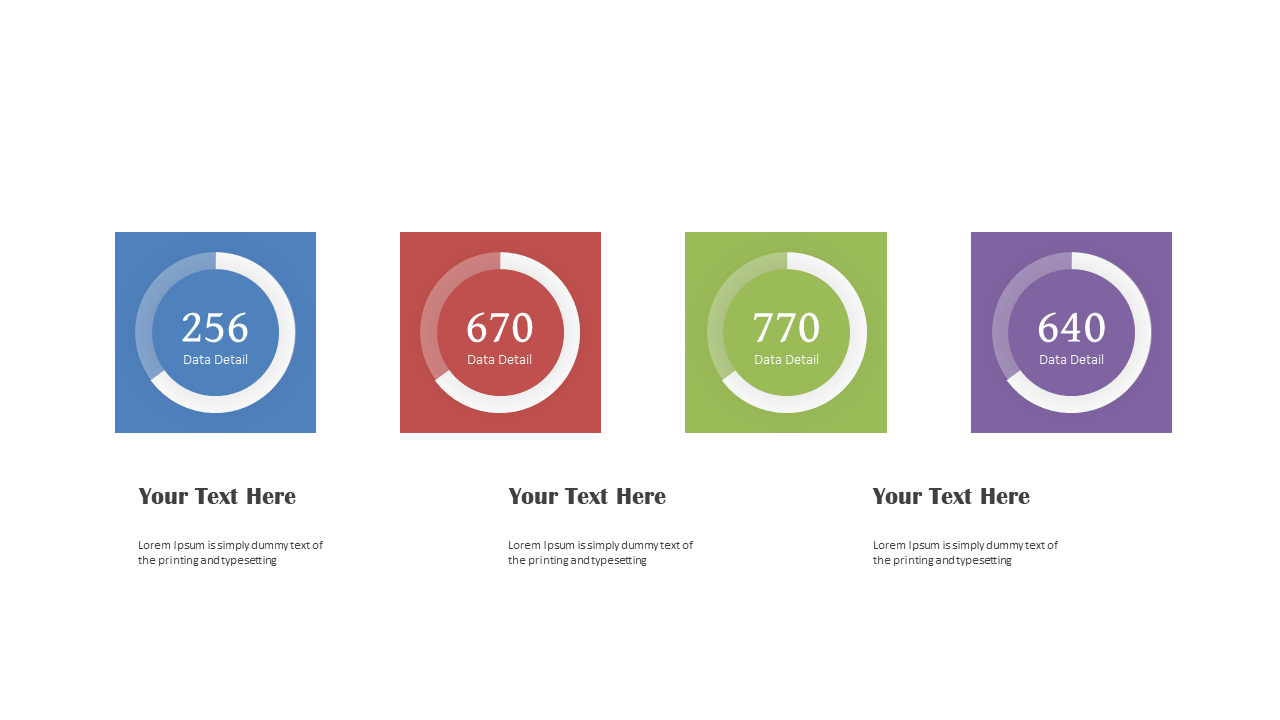
When you’re trying to convey multiple performance metrics, it can be easy to lose your audience in the details. This slide features a clean quadrant layout paired with circular progress indicators, making it simple to visualize important data points at a glance. It’s crafted to help your audience absorb information quickly and effectively.
Data analysts, team leaders, and business strategists will find this layout particularly useful in a variety of settings. Use it for performance reviews, project assessments, or strategic planning sessions to present a comprehensive view of your metrics.
The organized structure allows for easy comparison, guiding your audience through the data smoothly. At just $0.99, this slide is available for immediate download and can be edited effortlessly in PowerPoint and Google Slides. Spend just a few minutes customizing it to your needs, and you’ll be ready to impress your audience without the stress.
$0.99 – Purchase Checkout
Added to cart







