Visualize Survey Results with Circular Breakdown
Product Description
Translating survey results into insights can be a daunting task, especially when dealing with a wealth of data. You want your audience to grasp the key takeaways quickly, without the confusion that often accompanies complex figures.
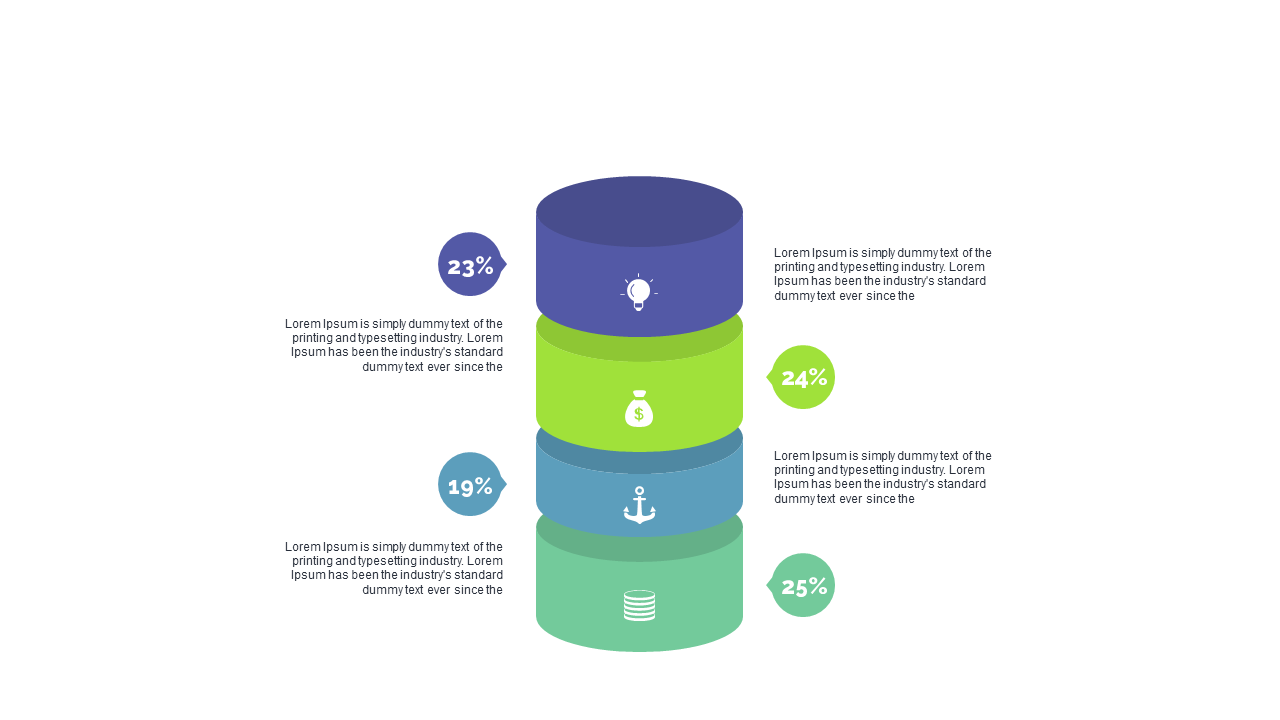
This circular breakdown slide simplifies that process, offering a clear and engaging way to present findings. Market researchers conducting focus groups, HR professionals sharing employee feedback, and product managers analyzing user surveys will find this slide invaluable. It transforms dense data into digestible chunks, making your presentation more engaging in team meetings or client briefings.
Download this visually appealing slide for only $0.99 and enjoy the benefits of an easy-to-edit format compatible with PowerPoint and Google Slides. You’ll have it ready to impress your audience in a matter of minutes, keeping your focus on the insights that matter.
$0.99 – Purchase Checkout
Added to cart







