Engaging Percentage Distribution with Icons
Product Description
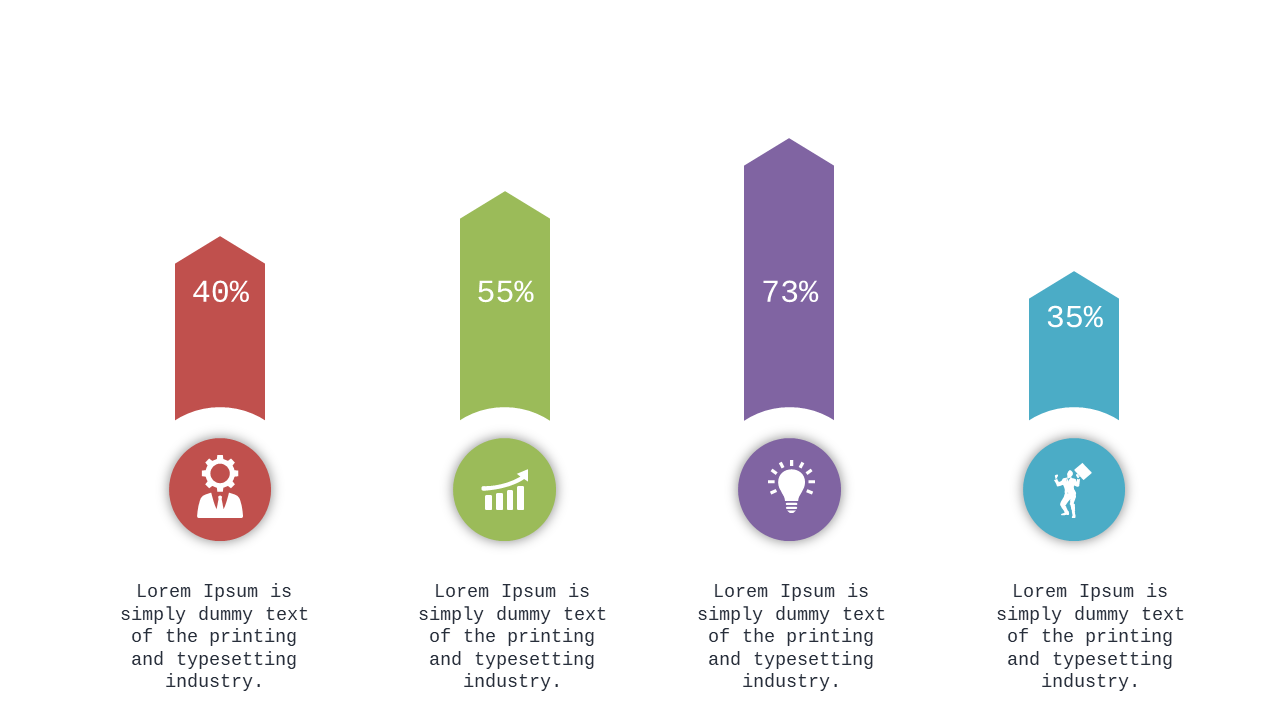
Presenting percentage data can often feel monotonous, causing your audience to zone out. This slide turns dry statistics into a visually engaging story, using appealing icons that draw attention and enhance understanding. With clear percentages alongside eye-catching visuals, you can make numbers come to life.
Data analysts and marketing professionals will find this slide especially useful during quarterly reports or strategy meetings. It’s also a great fit for sales presentations when illustrating market share or product performance.
Anyone who needs to convey numerical data clearly will benefit from this engaging format. For just $0.99, you can easily download this slide and edit it to fit your needs in PowerPoint or Google Slides. You’ll be ready to present in minutes, transforming your data into a visually compelling narrative that captures your audience’s interest.
$0.99 – Purchase Checkout
Added to cart







