Visualize Percentage Distributions with Clarity
Product Description
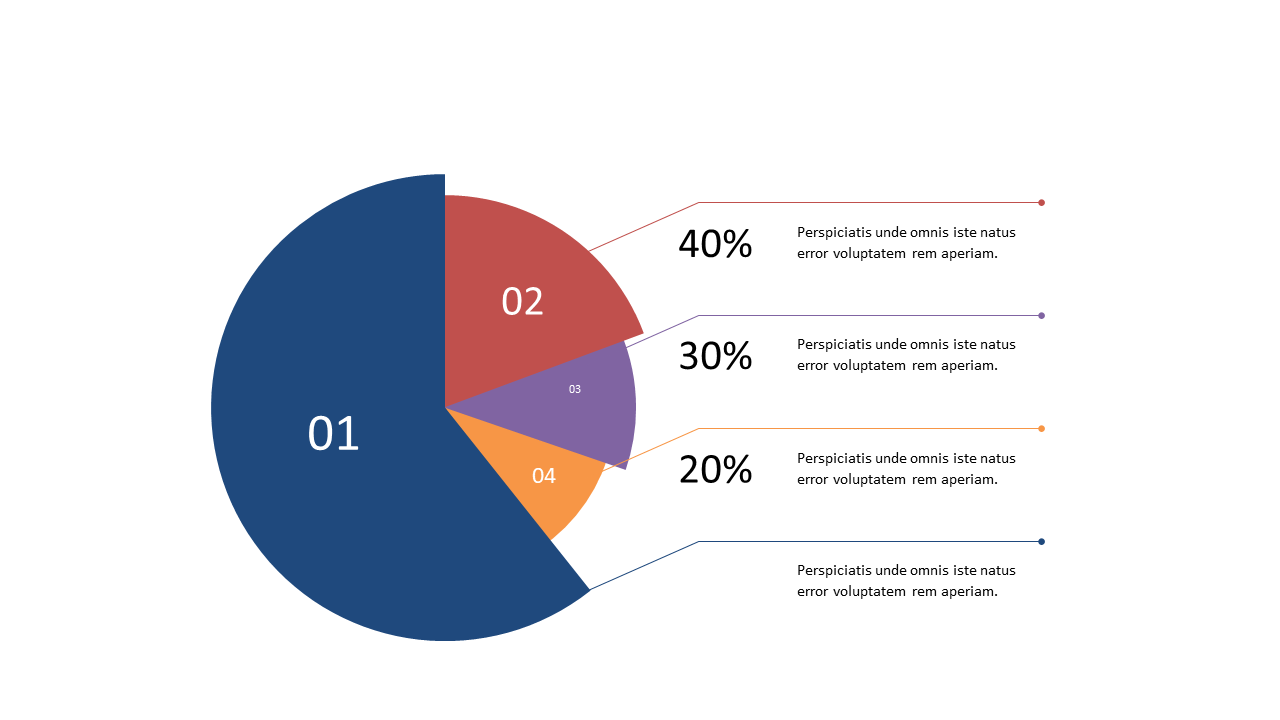
When presenting data that involves percentage distributions, it can be challenging to ensure that your audience quickly comprehends the figures. This slide features a clean, circular diagram designed to visually represent your data with clarity, highlighting key percentages in a way that’s easy to digest.
Whether you’re a financial analyst showcasing budget allocations, a marketer presenting survey results, or a sales manager detailing market share comparisons, this slide is an ideal fit. It’s designed to make your numbers stand out and support your message effectively in any presentation setting.
Available for only $0.99, this slide is an instant download and straightforward to edit in both PowerPoint and Google Slides. You’ll be able to tailor it to your specific data needs in no time, enhancing your presentation’s impact.
$0.99 – Purchase Checkout
Added to cart







