Display Market Share with Circular Graphics
Product Description
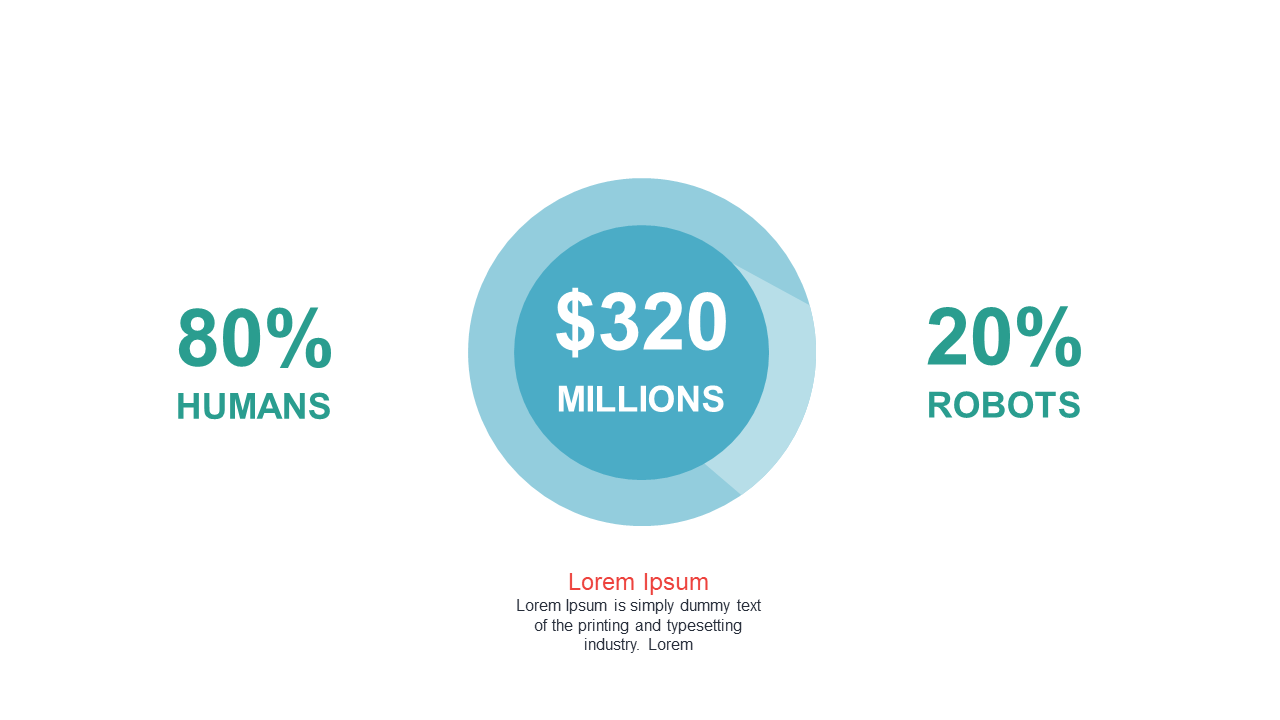
Making sense of market share data can be a daunting task, especially when you want your audience to grasp the key points quickly. If you find yourself overwhelmed with complicated percentages, this circular graphic slide breaks it down in a straightforward way.
It helps your audience visualize how different entities stack up against each other. This slide is ideal for business analysts reporting on competitive landscapes, marketing directors evaluating product performance, or sales teams presenting territory breakdowns. You can use it during strategic planning meetings, client briefings, or investor pitches where clear insights are essential.
Available for just $0.99, this slide is ready for instant download and easy to edit in PowerPoint or Google Slides. Transform your data presentations within minutes and provide clarity that drives impactful discussions.
$0.99 – Purchase Checkout
Added to cart







