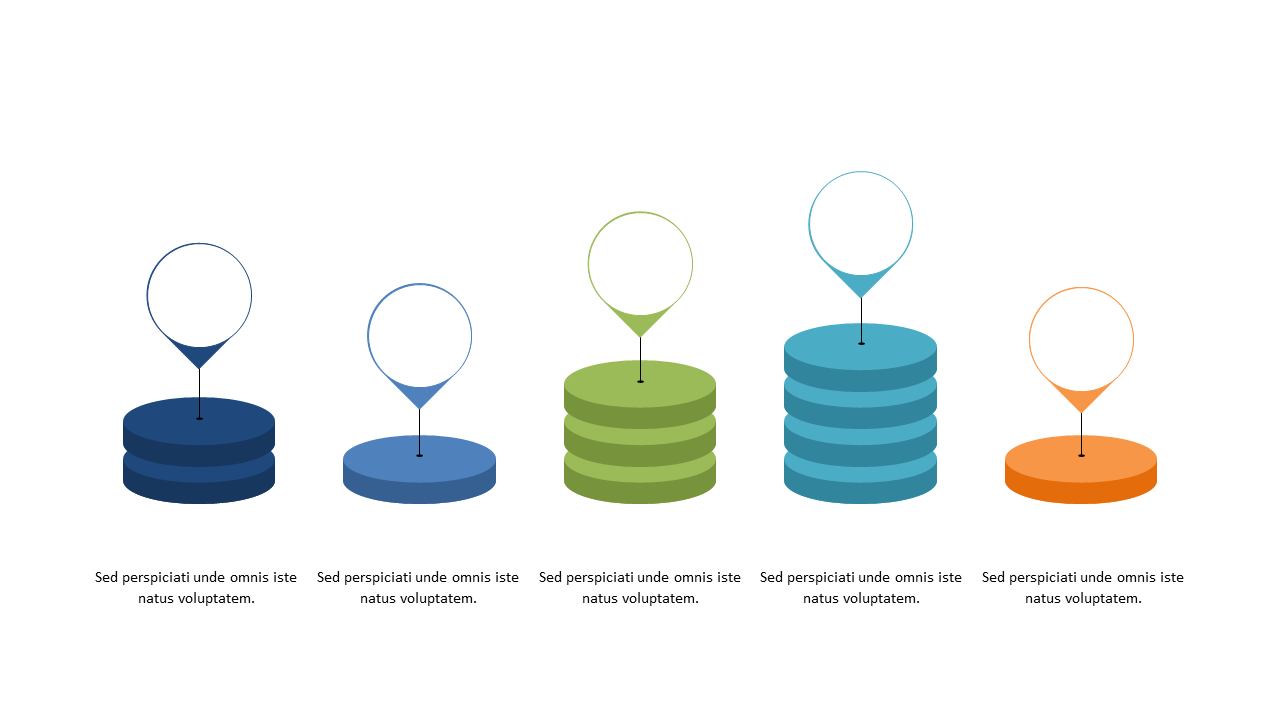
Display Data Trends with Stacked Circular Elements
Product Description
Presenting complex data trends can often feel like trying to decode a foreign language. If your audience struggles to understand charts and graphs, this slide can simplify your message.
The stacked circular elements organize information into a visually accessible format that enhances comprehension. This slide is perfect for data analysts who need to present quarterly reports, marketing managers showcasing campaign performance, or finance professionals discussing revenue growth. It fits seamlessly into board meetings, team reviews, or strategy sessions where clarity is crucial for decision-making.
For just $0.99, you can download this slide, fully editable in both PowerPoint and Google Slides. Get ready to enhance your presentations in minutes, making your data visual and easy to digest for any audience.
$0.99 – Purchase Checkout
Added to cart







